
Shiba Inu Faces Potential Death Cross: Is SHIB Price Heading Further Down?

Shiba Inu is nearing a critical technical juncture as bearish momentum builds, RSI weakens, and a death cross looms on the charts.
Shiba Inu (SHIB) is under pressure, down 6.5% in the last 24 hours and over 21% in the past 30 days. Momentum indicators show mixed signals, with the RSI falling sharply into neutral territory and the BBTrend turning mildly positive after a deep bearish stretch.
Meanwhile, technical analysis points to a possible death cross forming on the EMA lines, which could trigger further downside unless bulls regain control. With SHIB nearing key support levels, traders are watching closely for confirmation of a breakdown—or signs of a reversal.
Shiba Inu RSI Slides Into Neutral Zone: What Comes Next?
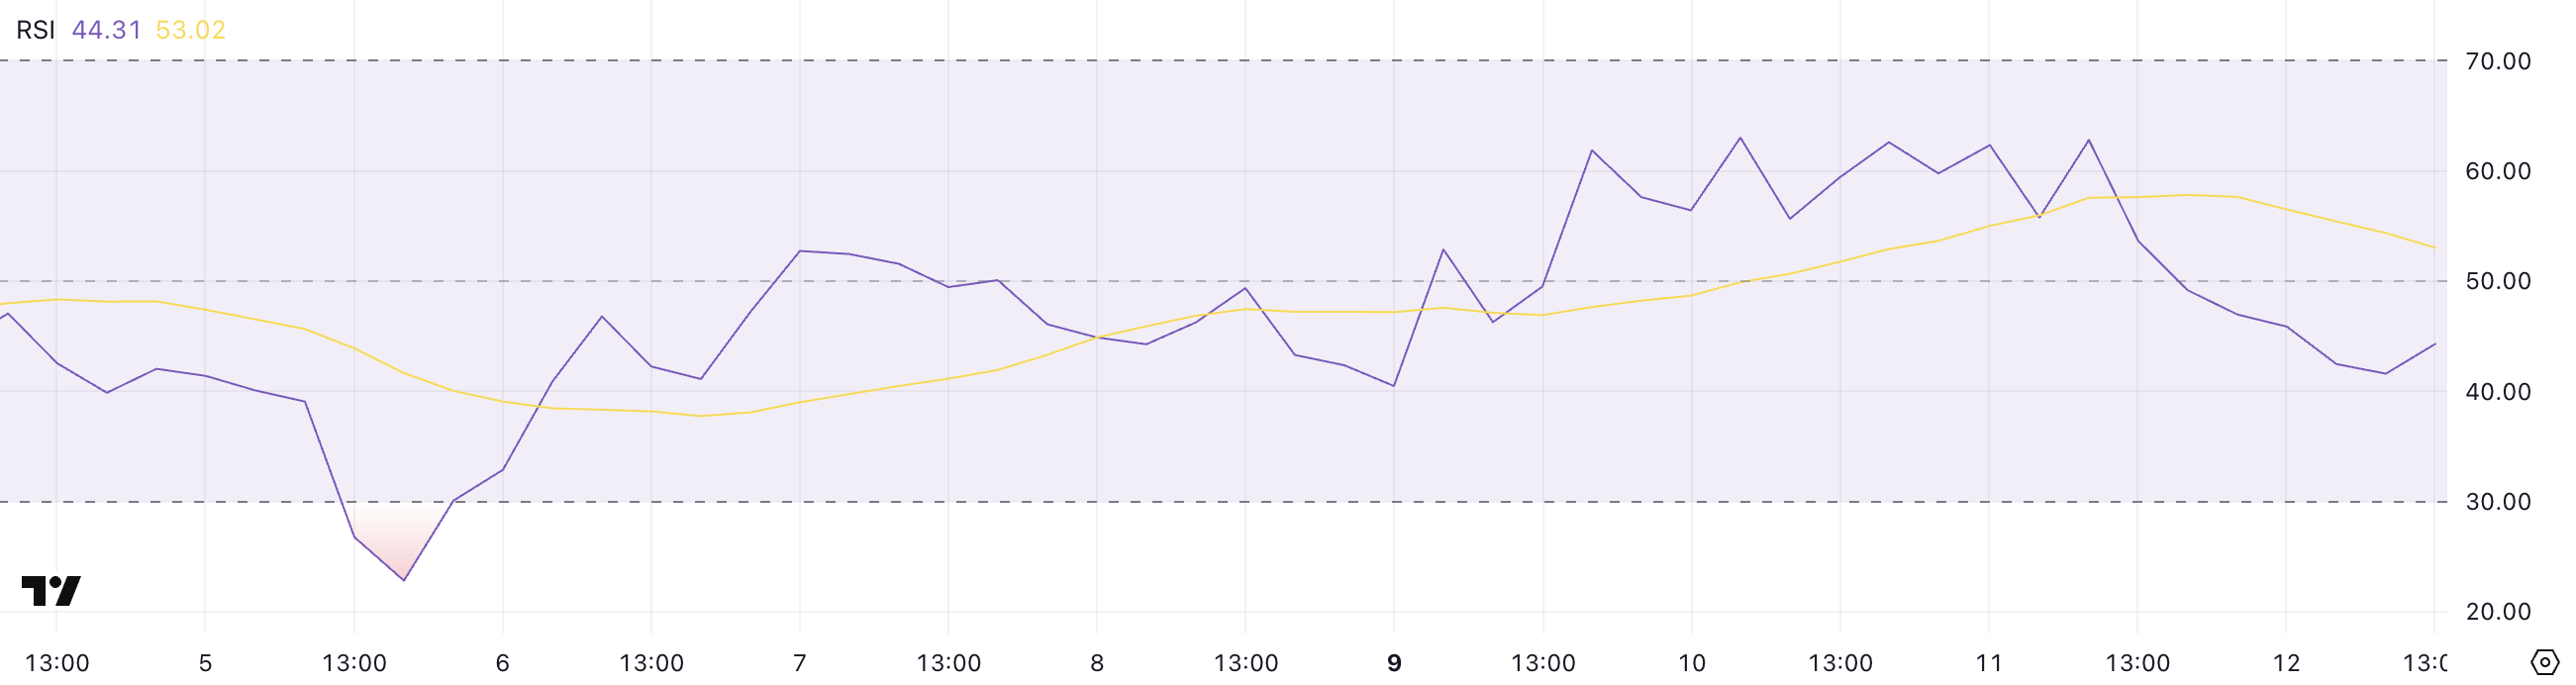
Shiba Inu Relative Strength Index (RSI) has dropped significantly, now sitting at 44.31—down from 62.8 just yesterday.
This sharp decline suggests that recent selling pressure has intensified, pushing SHIB out of the bullish zone and into neutral territory.
The shift could reflect profit-taking or a short-term cooling after a recent rally, and it marks a notable change in momentum within just 24 hours.
 SHIB RSI. Source:
TradingView.
SHIB RSI. Source:
TradingView.
RSI, or Relative Strength Index, is a momentum oscillator that measures the speed and magnitude of recent price movements on a scale from 0 to 100.
Readings above 70 typically indicate that an asset is overbought and may be due for a correction, while readings below 30 signal oversold conditions and potential for a bounce. With SHIB’s RSI at 44.31, the token is now in a neutral range, suggesting indecision among traders.
If the RSI continues to fall, it could indicate further downside ahead, but if it stabilizes or reverses upward, it may signal renewed buying interest before SHIB reaches oversold territory.
Shiba Inu BBTrend Turns Positive After Deep Bearish Stretch
Shiba Inu BBTrend has climbed to 0.54, a sharp recovery from a negative low of -3.25 just three days ago.
This upward shift marks a potential change in momentum, indicating that bearish pressure may be easing and early signs of bullish strength are emerging.
While the move is still modest, it reflects improving sentiment as SHIB attempts to stabilize after recent weakness.
 SHIB BBTrend. Source:
TradingView.
SHIB BBTrend. Source:
TradingView.
BBTrend, or Bollinger Band Trend, measures the directional strength of price movement relative to Bollinger Bands. Values above 0 suggest upward momentum, while values below 0 indicate bearish trends.
SHIB’s current BBTrend of 0.54 suggests a weak but growing bullish bias.
If the trend continues rising, it could signal the start of a recovery phase, potentially attracting renewed interest from short-term traders anticipating a breakout above key resistance levels.
SHIB Eyes Death Cross: Breakdown or Reversal Ahead?
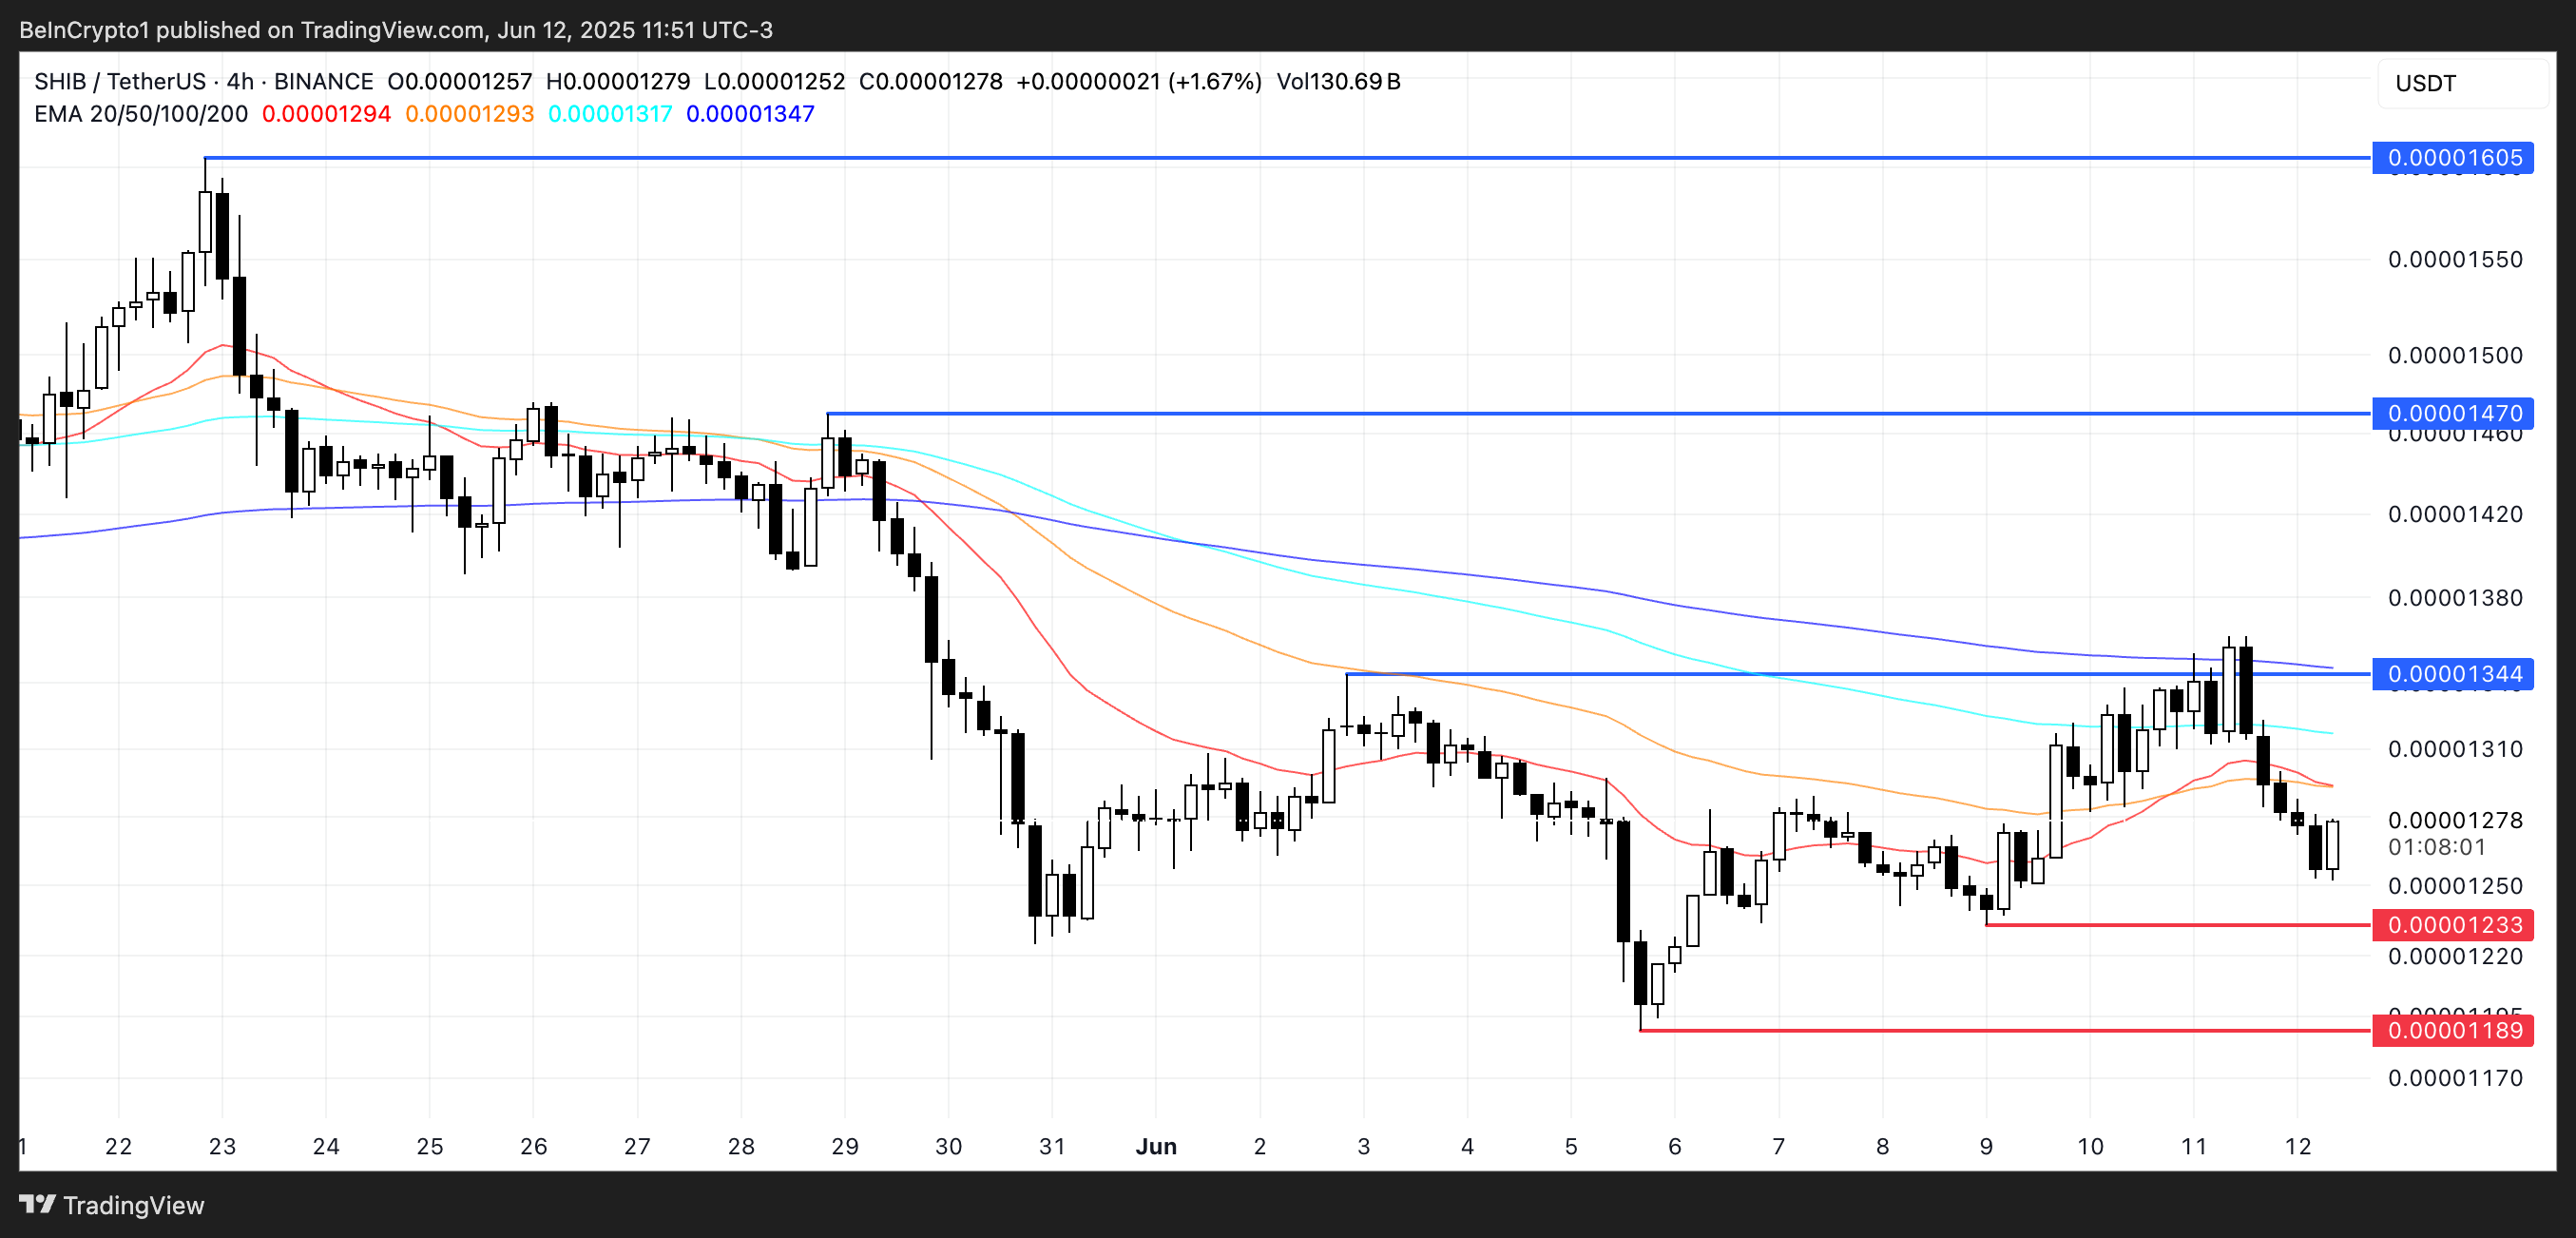
Shiba Inu EMA lines are showing signs of weakness, with a potential death cross formation on the horizon. A death cross occurs when the short-term EMA crosses below the long-term EMA, typically signaling a bearish trend reversal.
If this pattern confirms, SHIB price could fall to test the support level at $0.0000123.
A break below that zone may accelerate downside pressure, pushing the price toward $0.0000118.
 SHIB Price Analysis. Source:
TradingView.
SHIB Price Analysis. Source:
TradingView.
However, if SHIB manages to regain upward momentum before the death cross confirms, a reversal could lead to a retest of the $0.0000134 resistance level.
Breaking above that would shift short-term sentiment and could trigger further gains toward $0.0000147 and $0.0000160. These targets would only become likely if buying pressure returns and invalidates the current bearish setup.
As SHIB consolidates, traders are closely watching whether the EMA lines confirm the bearish signal—or if bulls can flip the trend in time.
Disclaimer: The content of this article solely reflects the author's opinion and does not represent the platform in any capacity. This article is not intended to serve as a reference for making investment decisions.
You may also like
Jensen Huang: Nvidia chip sales will double next year compared to this year, AI cannot be regulated like social media
Jensen Huang opposes applying social media regulations directly to AI, arguing that social media is a product, while AI is an underlying technology that supports other technologies and products. He believes regulation should target products, not the technology itself. He emphasizes rigorous testing and states that products should be withheld from release if they are not safe enough. "AI safety is of utmost importance."
What to buy after the Federal Reserve raises interest rates? Historically, US energy and technology stocks outperform while real estate lags. Goldman Sachs: The pace of rate hikes determines the US stock market.
U.S. stock performance in the 12 months after the first Federal Reserve rate hike: According to Jefferies, the energy sector led with an average return of 22.4%, followed by information technology at 15.4%. According to Charles Schwab, real estate underperformed the S&P 500 by 4.3%, making it the worst of the 11 sectors. Goldman Sachs states that the pace of rate hikes is the core variable affecting U.S. stocks; currently, if the 10-year U.S. Treasury yield rises by 50 basis points within a month, it will create "rapid rate hike" pressure.
Bank of America Ripple Report Fuels XRP Debate
Gold surges over 2%, US dollar retraces gains after Federal Reserve decision
Crypto prices
More


