
ADA Breakout Imminent? Cardano News Today Signals Bull Run!

Cardano (ADA) price is showing signs of a fresh breakout after a phase of consolidation. On the daily chart, the price closed at $0.78482, marking a 3.3% gain for the day. This green Heikin Ashi candle with a long body and no lower wick signals bullish momentum. Notably, ADA price has reclaimed both the 20-day and 50-day moving averages and is now pressing against the 100-day SMA at $0.79913, which has acted as a stubborn resistance.
This breakout attempt comes after a minor pullback last week where Cardano price briefly retested support near the $0.72 zone, corresponding to pivot support (S1) and the 50-day SMA. The bounce from that level created a higher low pattern—a key bullish signal.
Cardano News Today: What Are the Key Resistance and Support Levels?
 ADA/USD 1 Hr Chart- TradingView
The hourly chart reveals Cardano price consolidating above its major moving averages (20, 50, 100, and 200 SMA) with increasing candle volume. Currently trading around $0.79713, the hourly chart shows ADA moving in a narrow ascending channel, suggesting accumulation before a larger move.
Using pivot levels from both charts:
- Immediate resistance lies at $0.80, aligned with the R2 daily pivot and the 100-day SMA.
- A break above $0.80 could take ADA toward $0.86–$0.88, which matches the R3 level seen on the daily chart.
- On the downside, firm support is visible at $0.75 and $0.72, supported by 20/50-day SMAs and horizontal demand zones.
Is This Rally Backed by Volume and Moving Averages?
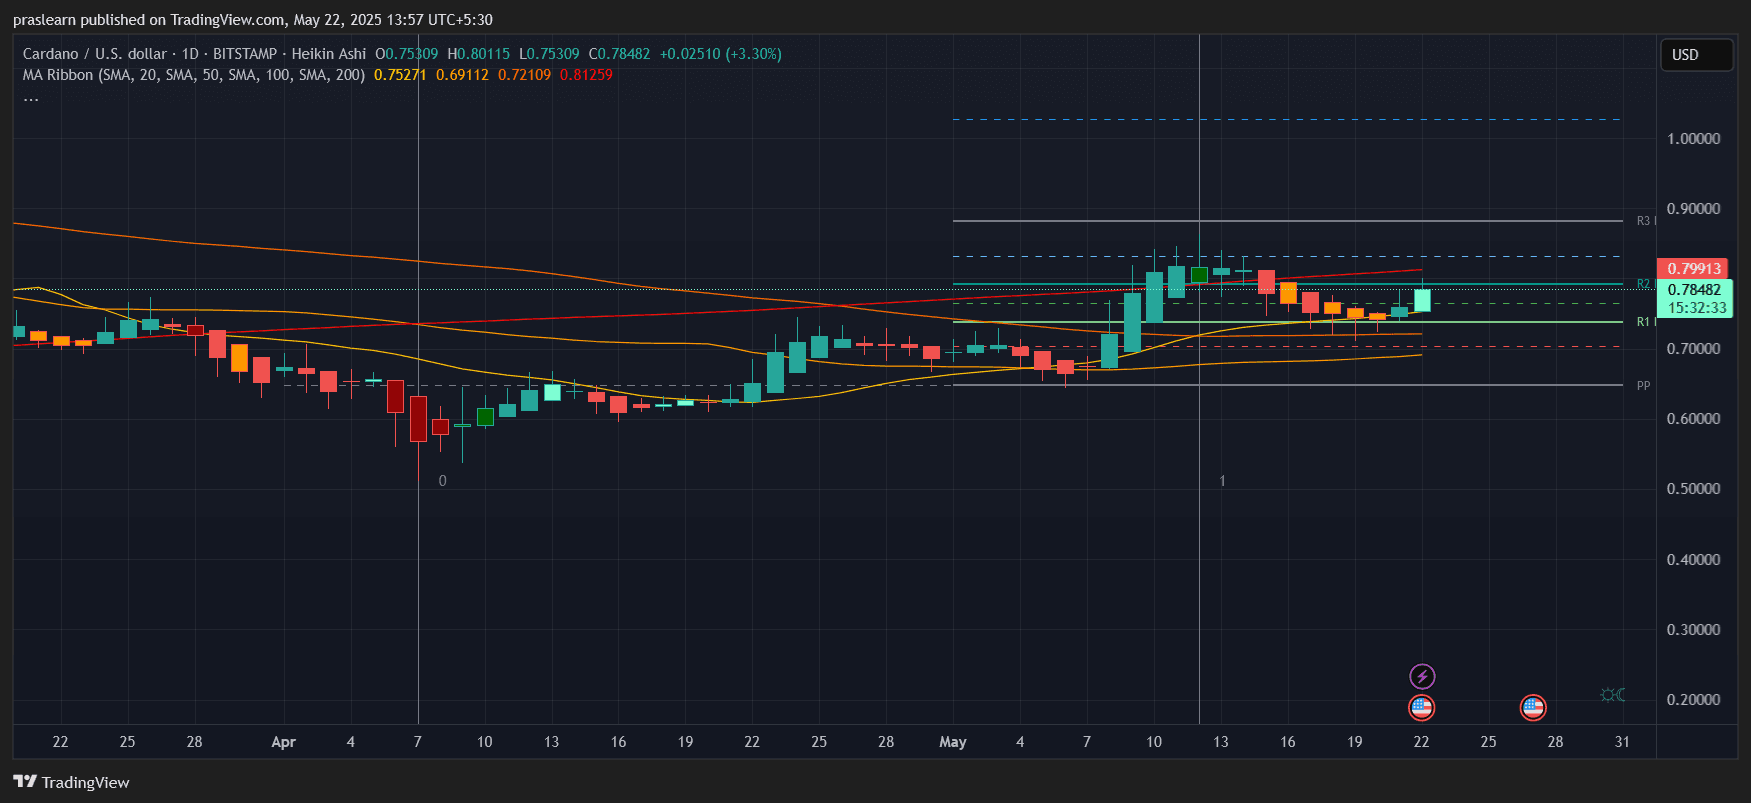 ADA/USD 1 Day Chart- TradingView
Yes. On the daily chart, ADA price is trading above the 20-day ($0.75271) and 50-day ($0.69112) SMAs. These crossovers often attract trend-following buyers. Additionally, the 200-day SMA at $0.81259 is now in focus. If ADA breaks and holds above this level, the medium-term bias will flip strongly bullish.
Let’s validate this move using a moving average ribbon compression breakout. Between May 10 and May 20, the 20, 50, and 100 SMAs were tightly compressed. Historically, such squeezes lead to sharp moves. The current price action confirms a post-compression expansion—typically bullish.
What Do Fibonacci and Risk-Reward Say?
Using Fibonacci retracement from the April swing high ($0.89) to the May low ($0.67), ADA price recently reclaimed the 61.8% retracement level at ~$0.79, which is significant. This level often acts as a magnet for price action.
From a risk-reward standpoint:
- Entry near $0.78
- Stop-loss at $0.72 (recent higher low)
- Target 1 at $0.86
- Target 2 at $0.89
This gives a reward of $0.08–$0.11 versus a risk of $0.06, resulting in an R:R ratio of 1.3 to 1.8, which favors the bulls.
Cardano News Today: What’s the Cardano Price Prediction for the Week Ahead?
If Cardano price sustains above the $0.78–$0.80 range for the next 24–48 hours, momentum traders could push it toward $0.86 quickly, especially if Bitcoin remains above $68,000. Any break and close above the $0.81259 (200-day SMA) would confirm a long-term reversal pattern.
However, failure to break $0.80 convincingly could result in a retest of $0.75. If that level fails, ADA price may revisit $0.72—but that scenario currently seems unlikely given the increasing bullish volume and strong Heikin Ashi candles.
Conclusion
Cardano news today is showing early signs of a new upward leg . If bulls clear the $0.80 barrier, ADA could rally toward $0.86 and beyond. Keep an eye on volume spikes and moving average support to confirm the breakout.
Cardano (ADA) price is showing signs of a fresh breakout after a phase of consolidation. On the daily chart, the price closed at $0.78482, marking a 3.3% gain for the day. This green Heikin Ashi candle with a long body and no lower wick signals bullish momentum. Notably, ADA price has reclaimed both the 20-day and 50-day moving averages and is now pressing against the 100-day SMA at $0.79913, which has acted as a stubborn resistance.
This breakout attempt comes after a minor pullback last week where Cardano price briefly retested support near the $0.72 zone, corresponding to pivot support (S1) and the 50-day SMA. The bounce from that level created a higher low pattern—a key bullish signal.
Cardano News Today: What Are the Key Resistance and Support Levels?
ADA/USD 1 Hr Chart- TradingView
The hourly chart reveals Cardano price consolidating above its major moving averages (20, 50, 100, and 200 SMA) with increasing candle volume. Currently trading around $0.79713, the hourly chart shows ADA moving in a narrow ascending channel, suggesting accumulation before a larger move.
Using pivot levels from both charts:
- Immediate resistance lies at $0.80, aligned with the R2 daily pivot and the 100-day SMA.
- A break above $0.80 could take ADA toward $0.86–$0.88, which matches the R3 level seen on the daily chart.
- On the downside, firm support is visible at $0.75 and $0.72, supported by 20/50-day SMAs and horizontal demand zones.
Is This Rally Backed by Volume and Moving Averages?
ADA/USD 1 Day Chart- TradingView
Yes. On the daily chart, ADA price is trading above the 20-day ($0.75271) and 50-day ($0.69112) SMAs. These crossovers often attract trend-following buyers. Additionally, the 200-day SMA at $0.81259 is now in focus. If ADA breaks and holds above this level, the medium-term bias will flip strongly bullish.
Let’s validate this move using a moving average ribbon compression breakout. Between May 10 and May 20, the 20, 50, and 100 SMAs were tightly compressed. Historically, such squeezes lead to sharp moves. The current price action confirms a post-compression expansion—typically bullish.
What Do Fibonacci and Risk-Reward Say?
Using Fibonacci retracement from the April swing high ($0.89) to the May low ($0.67), ADA price recently reclaimed the 61.8% retracement level at ~$0.79, which is significant. This level often acts as a magnet for price action.
From a risk-reward standpoint:
- Entry near $0.78
- Stop-loss at $0.72 (recent higher low)
- Target 1 at $0.86
- Target 2 at $0.89
This gives a reward of $0.08–$0.11 versus a risk of $0.06, resulting in an R:R ratio of 1.3 to 1.8, which favors the bulls.
Cardano News Today: What’s the Cardano Price Prediction for the Week Ahead?
If Cardano price sustains above the $0.78–$0.80 range for the next 24–48 hours, momentum traders could push it toward $0.86 quickly, especially if Bitcoin remains above $68,000. Any break and close above the $0.81259 (200-day SMA) would confirm a long-term reversal pattern.
However, failure to break $0.80 convincingly could result in a retest of $0.75. If that level fails, ADA price may revisit $0.72—but that scenario currently seems unlikely given the increasing bullish volume and strong Heikin Ashi candles.
Conclusion
Cardano news today is showing early signs of a new upward leg . If bulls clear the $0.80 barrier, ADA could rally toward $0.86 and beyond. Keep an eye on volume spikes and moving average support to confirm the breakout.
Disclaimer: The content of this article solely reflects the author's opinion and does not represent the platform in any capacity. This article is not intended to serve as a reference for making investment decisions.
You may also like
Famous US stock investor Eric Jackson joins Shanda Technology (SDA.US) Advisory Board to support the company's internationalization strategy and investor relations development
Eric Jackson, founder of EMJ Capital and renowned technology investor, has officially joined the company's advisory board.

In the era of AI inference, demand for "optical interconnects" is booming! Lumentum (LITE.US), "standing in the light," is ahead of NPO, expanding OCS to embrace the moment of profit surge
From an underlying engineering perspective, the growing demand for optical interconnection arises from more frequent and stricter data exchanges between computing nodes: expert parallelism in Mixture of Experts (MoE) models requires distributing and aggregating data across GPUs; Prefill–Decode Disaggregation necessitates the transfer of KV Cache; complex agent workflows increase the concurrency of model invocation, tool execution, and data access.

Federal Reserve rate hike rationale further reinforced! US August PPI sees biggest increase in three months, energy as main driver; tomorrow's CPI may determine the outcome
Driven by the rebound in energy product prices, the U.S. Producer Price Index (PPI) for August accelerated further, continuing a series of elevated readings since renewed hostilities between the U.S. and Iran. This may further strengthen the case for the Federal Reserve to raise interest rates at next week's meeting.

Macy's Raises Full-Year Outlook Following Fiscal Second-Quarter Beat
Crypto prices
More


