
What If You Invest $1,000 in TRUMP Coin Right Now?

The Official Trump (TRUMP) coin is back in the spotlight with a fresh breakout and bullish momentum brewing across both short- and long-term charts. With renewed political buzz and meme coin hype returning, investors are now asking the big question is it the right time to jump in?
Let’s break down the charts and explore whether a $1,000 investment today could become something bigger tomorrow.
OFFICIAL TRUMP Price: Is TRUMP Price Gearing Up for a Major Rally?
 TRUMP/USD Daily Chart- TradingView
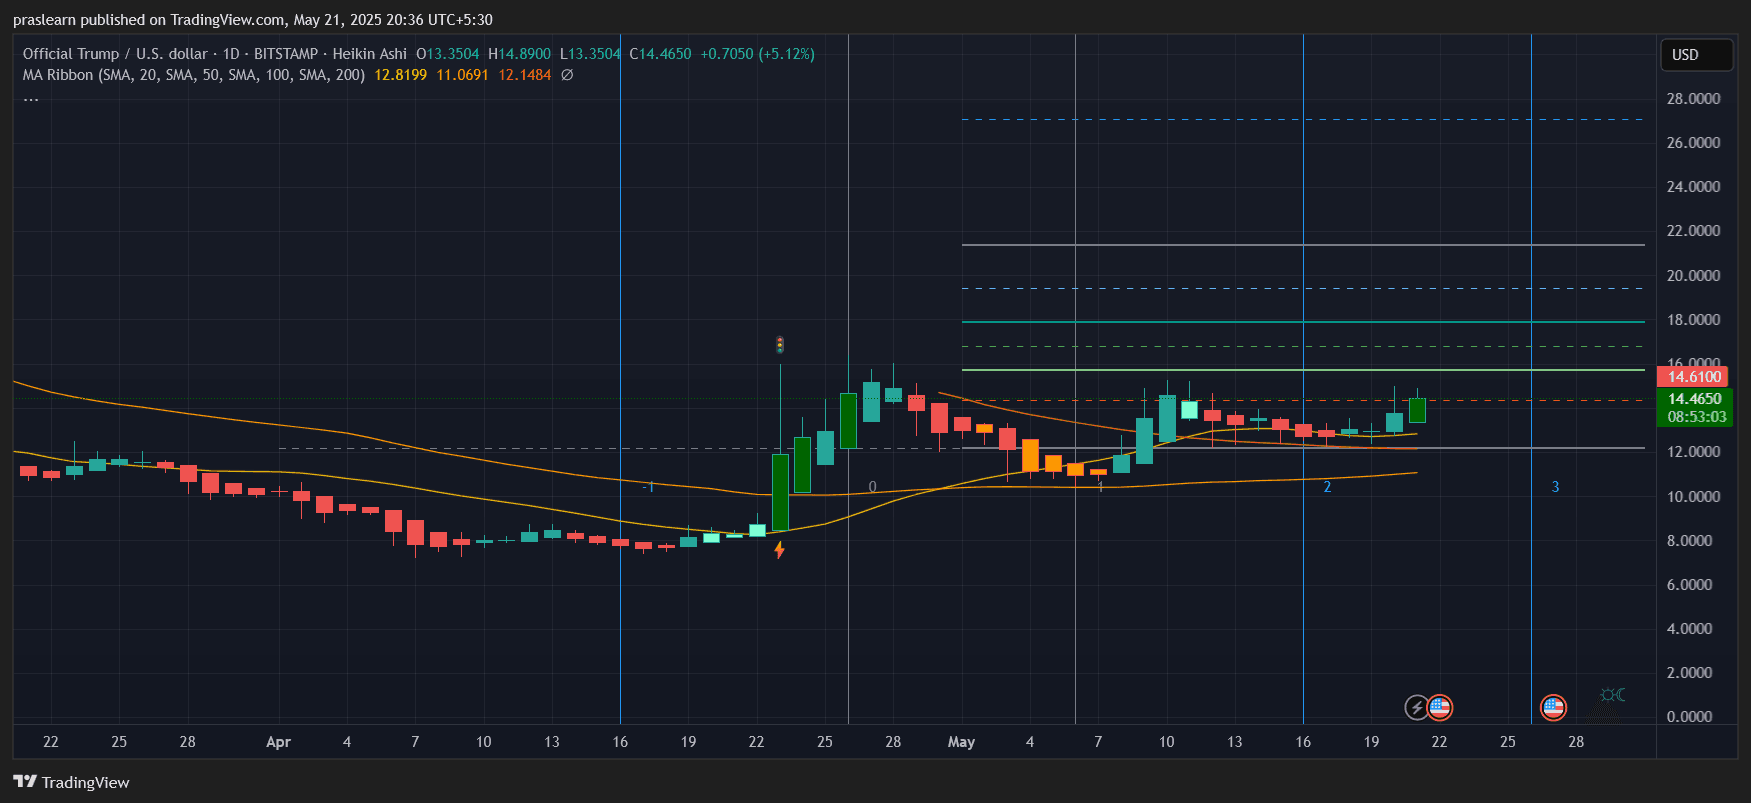
Looking at the daily chart, TRUMP price is attempting a solid comeback after consolidating for weeks between $11 and $13. The latest candle closed at $14.46, a +5.12% move in a single day, signaling renewed bullish interest.
More importantly, the price has now flipped above all key moving averages:
- 20 SMA: $12.81
- 50 SMA: $11.06
- 100 SMA: $12.14
This breakout above long-term resistance is a bullish technical signal. The previous swing high near $16 is now in sight, and if broken, price could target $18.70, followed by a psychological test of $20.
What's the Hourly Chart Telling Us?
 TRUMP/USD 1 Hr Chart- TradingView
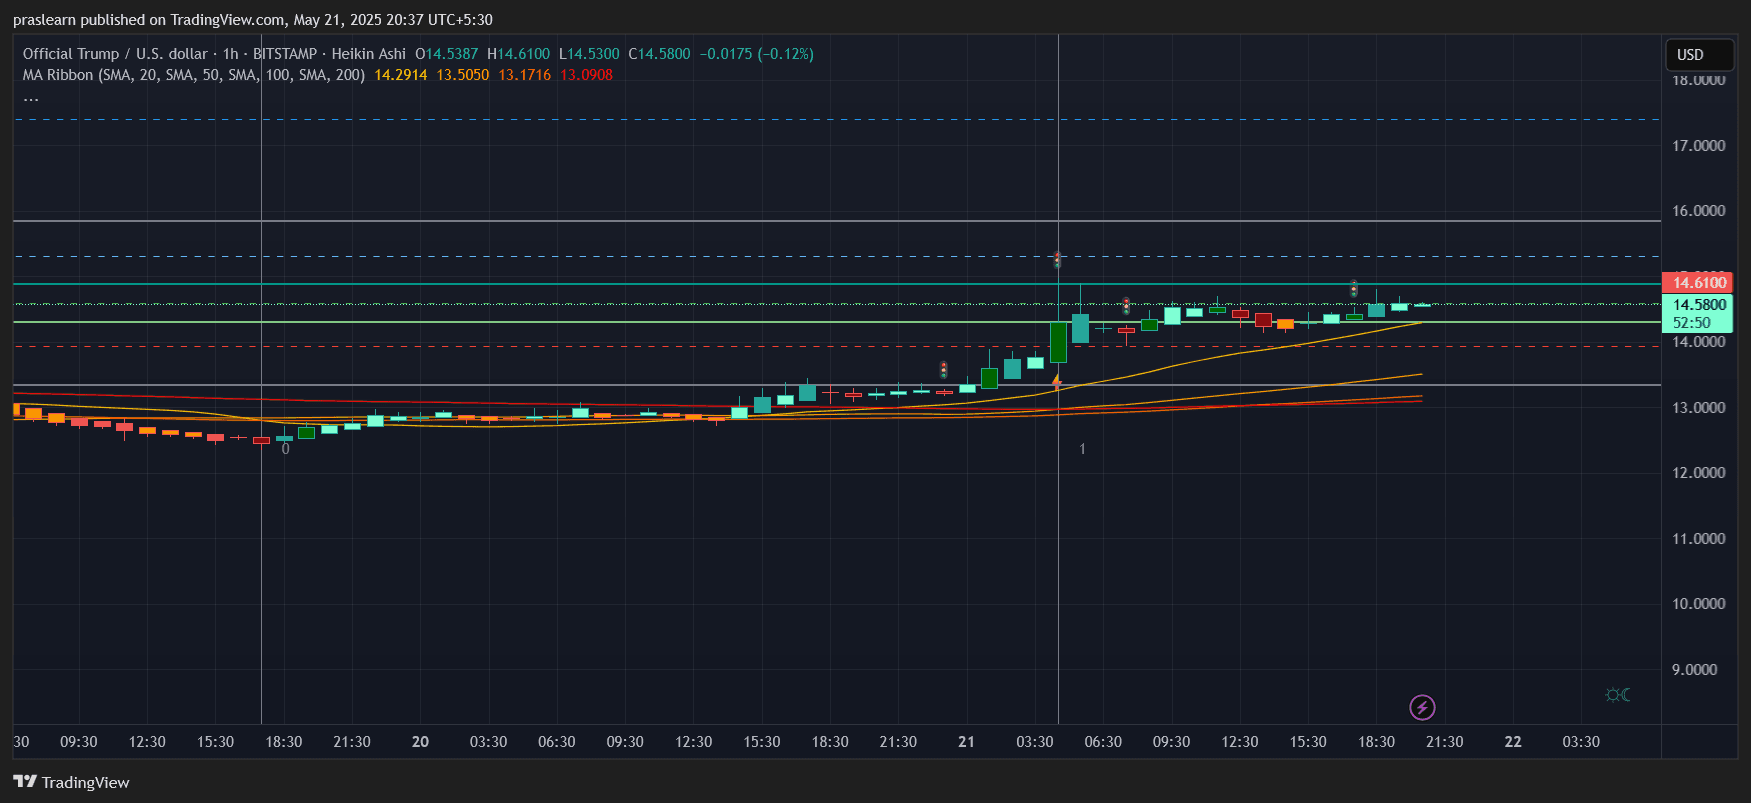
Zooming into the 1-hour chart , the Heikin Ashi candles show clean higher highs and higher lows—a textbook uptrend. The OFFICIAL TRUMP price is trading above the 20, 50, 100, and 200 SMAs:
- Immediate support: $14.29 (20 SMA)
- Near-term resistance: $14.61
The current structure is forming a flag-like continuation pattern, often preceding strong moves. If OFFICIAL TRUMP price sustains above $14.50 , we could see a near-term spike toward $16. The volume spikes seen earlier today support this bullish setup, pointing to accumulation.
If You Invest $1,000 in TRUMP Coin Today...
At the current price of $14.46, a $1,000 investment gets you approximately 69.19 TRUMP coins.
Now, let’s consider two potential upside scenarios based on chart targets:
- Scenario 1: TRUMP Price hits $18.70 (short-term breakout target)
Value of holdings = 69.19 × 18.70 = $1,294.85
Return = +29.48% - Scenario 2: TRUMP Price hits $25 (medium-term meme pump hype)
Value = 69.19 × 25 = $1,729.75
Return = +72.98%
The upside becomes even more attractive if TRUMP price reclaims its previous all-time highs closer to $30.
Is There Risk of a Pullback?
Absolutely. If TRUMP price fails to hold above the key support at $14.00 , a short-term correction toward $13 or even $12.20 is possible. The 50 and 100 SMAs on the daily chart will act as cushions, but a breakdown below $12 would weaken the current bullish thesis.
So for anyone investing now, it’s crucial to monitor the $14 level closely. It’s acting as a pivot, and price action around it in the next 24–48 hours will set the tone for what’s next.
Final Thoughts: Should You Buy TRUMP Coin Today?
From a technical standpoint, the OFFICIAL TRUMP price is breaking out from a textbook consolidation zone with strong moving average support and bullish momentum on both hourly and daily timeframes.
If the OFFICIAL TRUMP price holds above $14.50 and breaks $16, this could be the beginning of a mini-altseason for political and meme tokens. The upside toward $18–$25 is real, backed by both chart structure and upcoming political catalysts.
A $1,000 bet today isn’t guaranteed to double overnight—but it could very well ride the next meme wave if sentiment catches fire. In crypto, timing the trend is everything—and TRUMP price seems ready to make headlines again.
The Official Trump (TRUMP) coin is back in the spotlight with a fresh breakout and bullish momentum brewing across both short- and long-term charts. With renewed political buzz and meme coin hype returning, investors are now asking the big question is it the right time to jump in?
Let’s break down the charts and explore whether a $1,000 investment today could become something bigger tomorrow.
OFFICIAL TRUMP Price: Is TRUMP Price Gearing Up for a Major Rally?
TRUMP/USD Daily Chart- TradingView
Looking at the daily chart, TRUMP price is attempting a solid comeback after consolidating for weeks between $11 and $13. The latest candle closed at $14.46, a +5.12% move in a single day, signaling renewed bullish interest.
More importantly, the price has now flipped above all key moving averages:
- 20 SMA: $12.81
- 50 SMA: $11.06
- 100 SMA: $12.14
This breakout above long-term resistance is a bullish technical signal. The previous swing high near $16 is now in sight, and if broken, price could target $18.70, followed by a psychological test of $20.
What's the Hourly Chart Telling Us?
TRUMP/USD 1 Hr Chart- TradingView
Zooming into the 1-hour chart , the Heikin Ashi candles show clean higher highs and higher lows—a textbook uptrend. The OFFICIAL TRUMP price is trading above the 20, 50, 100, and 200 SMAs:
- Immediate support: $14.29 (20 SMA)
- Near-term resistance: $14.61
The current structure is forming a flag-like continuation pattern, often preceding strong moves. If OFFICIAL TRUMP price sustains above $14.50 , we could see a near-term spike toward $16. The volume spikes seen earlier today support this bullish setup, pointing to accumulation.
If You Invest $1,000 in TRUMP Coin Today...
At the current price of $14.46, a $1,000 investment gets you approximately 69.19 TRUMP coins.
Now, let’s consider two potential upside scenarios based on chart targets:
- Scenario 1: TRUMP Price hits $18.70 (short-term breakout target)
Value of holdings = 69.19 × 18.70 = $1,294.85
Return = +29.48% - Scenario 2: TRUMP Price hits $25 (medium-term meme pump hype)
Value = 69.19 × 25 = $1,729.75
Return = +72.98%
The upside becomes even more attractive if TRUMP price reclaims its previous all-time highs closer to $30.
Is There Risk of a Pullback?
Absolutely. If TRUMP price fails to hold above the key support at $14.00 , a short-term correction toward $13 or even $12.20 is possible. The 50 and 100 SMAs on the daily chart will act as cushions, but a breakdown below $12 would weaken the current bullish thesis.
So for anyone investing now, it’s crucial to monitor the $14 level closely. It’s acting as a pivot, and price action around it in the next 24–48 hours will set the tone for what’s next.
Final Thoughts: Should You Buy TRUMP Coin Today?
From a technical standpoint, the OFFICIAL TRUMP price is breaking out from a textbook consolidation zone with strong moving average support and bullish momentum on both hourly and daily timeframes.
If the OFFICIAL TRUMP price holds above $14.50 and breaks $16, this could be the beginning of a mini-altseason for political and meme tokens. The upside toward $18–$25 is real, backed by both chart structure and upcoming political catalysts.
A $1,000 bet today isn’t guaranteed to double overnight—but it could very well ride the next meme wave if sentiment catches fire. In crypto, timing the trend is everything—and TRUMP price seems ready to make headlines again.
Disclaimer: The content of this article solely reflects the author's opinion and does not represent the platform in any capacity. This article is not intended to serve as a reference for making investment decisions.
You may also like
With the US midterm elections approaching, Wall Street bets on a divided Congress—will markets see a mild respite?
As the U.S. midterm elections approach, Wall Street is generally betting on a "divided Congress" scenario, with the Democratic Party taking back the House of Representatives and the Republican Party retaining the Senate. This is expected to limit radical policies and reduce uncertainty. Historical data shows that since 1950, when a divided Congress occurred under a Republican president, the average annual gain of U.S. stocks was 13.7%, higher than the 8.3% and 4.9% gains when either the Republican or Democratic Party controlled Congress alone. If the election results deviate from expectations, the market may still experience significant volatility.
Famous US stock investor Eric Jackson joins Shanda Technology (SDA.US) Advisory Board to support the company's internationalization strategy and investor relations development
Eric Jackson, founder of EMJ Capital and renowned technology investor, has officially joined the company's advisory board.

In the era of AI inference, demand for "optical interconnects" is booming! Lumentum (LITE.US), "standing in the light," is ahead of NPO, expanding OCS to embrace the moment of profit surge
From an underlying engineering perspective, the growing demand for optical interconnection arises from more frequent and stricter data exchanges between computing nodes: expert parallelism in Mixture of Experts (MoE) models requires distributing and aggregating data across GPUs; Prefill–Decode Disaggregation necessitates the transfer of KV Cache; complex agent workflows increase the concurrency of model invocation, tool execution, and data access.

Federal Reserve rate hike rationale further reinforced! US August PPI sees biggest increase in three months, energy as main driver; tomorrow's CPI may determine the outcome
Driven by the rebound in energy product prices, the U.S. Producer Price Index (PPI) for August accelerated further, continuing a series of elevated readings since renewed hostilities between the U.S. and Iran. This may further strengthen the case for the Federal Reserve to raise interest rates at next week's meeting.

Crypto prices
More


