
DOGE Price Alert: Bull Run or Bull Trap?

Dogecoin (DOGE) , the most recognized meme coin in the crypto market, has experienced a notable rally in early May 2025. However, its recent price action now shows signs of cooling off. A detailed analysis of the daily and hourly TradingView charts reveals crucial price levels, moving average signals, and Fibonacci projections that suggest where DOGE price might head next .
Dogecoin Price Prediction: What Do the Dogecoin Daily Charts Reveal?
 DOGE/USD Daily Chart- TradingView
On the daily chart, Dogecoin price is currently trading at around $0.2269 , showing a decline of over 3% in the last 24 hours. Despite this pullback, DOGE recently achieved a significant breakout above its multi-month descending trendline. This momentum allowed it to reclaim the 50-day simple moving average (SMA) positioned near $0.1955, which is now acting as a strong base support.
DOGE price recent push saw it rally from below $0.16 to as high as $0.26 before facing resistance. The 200-day SMA, now located at $0.2668, appears to be the major resistance zone capping any further upside. This level has rejected the price twice already, indicating that bulls are currently struggling to break through the longer-term trend barrier. The Fibonacci retracement also adds weight to this region, with the 0.382 level around $0.22 now acting as a support line amid the consolidation.
What’s Happening on the Hourly Chart?
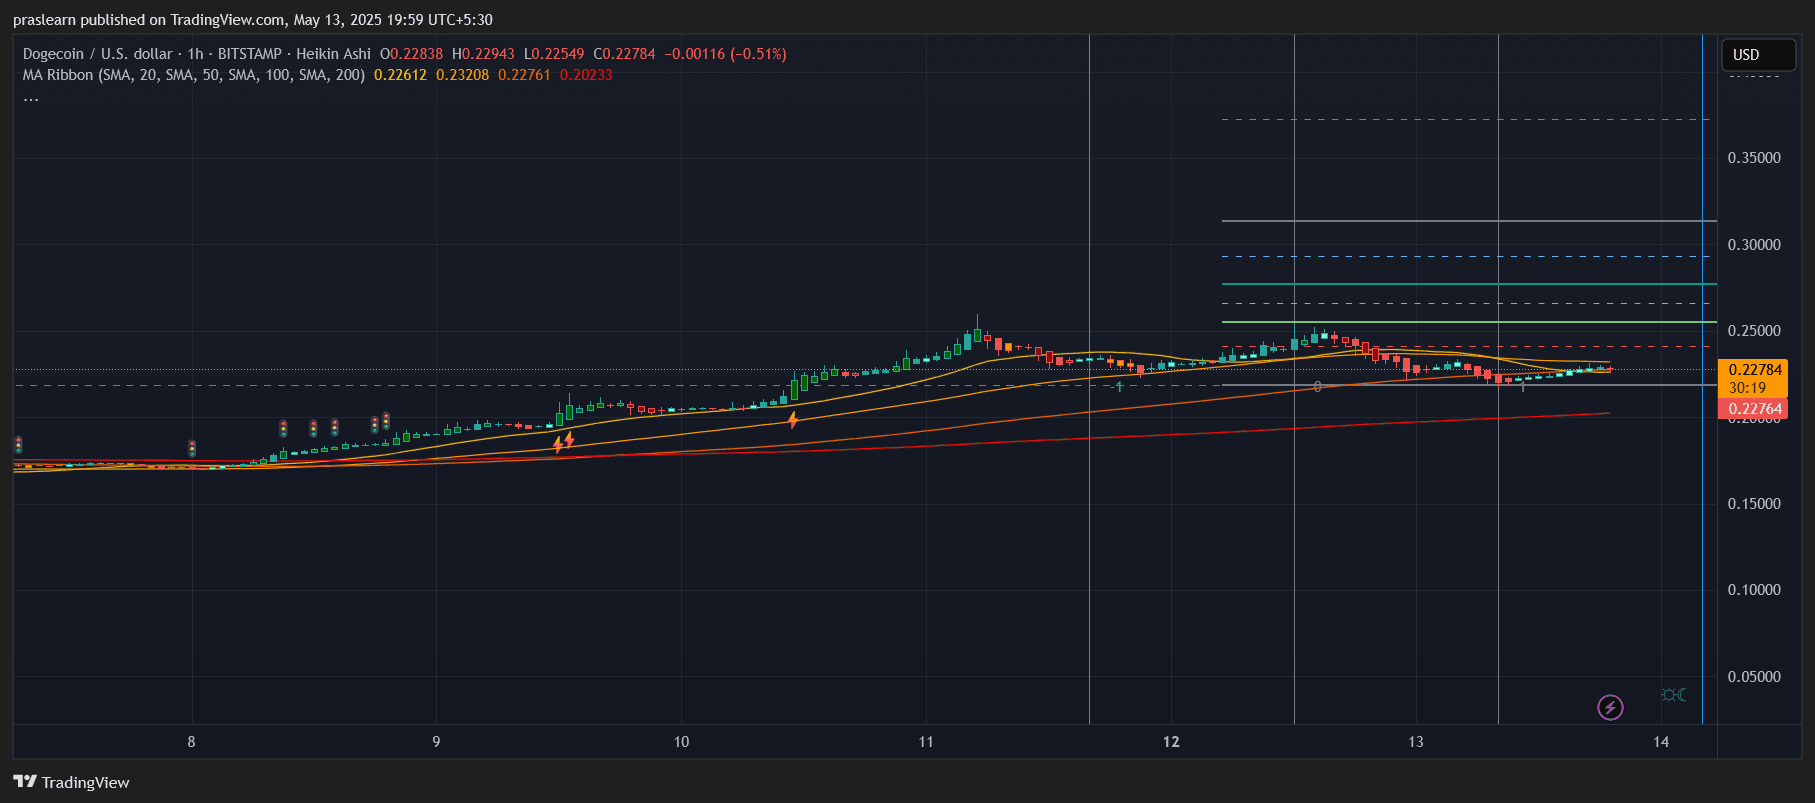 DOGE/USD 1 Hr Chart- TradingView
Zooming into the hourly chart, the sharp upward move that began around May 8 has started to lose steam. Dogecoin price reached a local high near $0.26 but has since entered a consolidation zone between $0.22 and $0.23. The moving averages on this timeframe are starting to flatten, suggesting that the immediate bullish momentum is fading.
At present, the price is hovering around $0.227. The 20-hour and 50-hour SMAs are tightly packed just above the current price, and the hourly candles are showing indecision. This reflects a balance between buyers and sellers. However, volume is tapering off, indicating that traders are waiting for a decisive move before taking fresh positions. If DOGE breaks below $0.226, a retest of the $0.223 to $0.220 zone is highly probable, which would also align with the lower support of the moving average ribbon.
Is There Still Upside for DOGE in May 2025?
To evaluate DOGE’s potential upward targets, we apply the Fibonacci extension tool using the recent impulse wave from approximately $0.15 to $0.26. The current consolidation level around $0.23 corresponds to the 0.236 retracement level, which often acts as a key decision point. If DOGE manages to hold this zone and push higher, the next technical targets will be $0.24, $0.27, and potentially even $0.30.
For Dogecoin price to make a move toward the $0.30 level , it must first decisively break through the 200-day SMA resistance at $0.2668. This would require a resurgence in volume and broader market support. A daily candle close above $0.24 would be the first signal of strength, and a close above $0.27 would likely trigger further buying pressure. On the flip side, if the $0.22 support fails, DOGE could revisit $0.195 or even test the 100-day SMA near $0.1750.
Dogecoin Price Prediction: Bullish or Bearish?
From a technical standpoint, Dogecoin price still holds a bullish structure , but the momentum is weakening. A break above $0.24 would open up the path toward $0.27 and $0.30, representing roughly a 32% upside from the current price.
However, if the price dips below $0.22, the bullish scenario would be invalidated, and bears may push it back toward the $0.195 support level.
Final Thoughts: Should You Buy the Dip?
Dogecoin’s recent run-up has injected new life into its price chart, but now it stands at a technical crossroads. The bullish breakout is still intact, provided DOGE continues to trade above the $0.22–$0.20 range. Traders and investors should keep a close watch on whether DOGE can reclaim $0.24 with volume support. If it does, the path toward $0.27 and beyond remains open. However, failure to hold key support levels could lead to a deeper correction.
For now, the DOGE price remains in a healthy consolidation phase , and accumulation within this range could precede the next big move. If sentiment across the crypto market turns favorable again, DOGE might surprise traders with another impulsive wave. But until that happens, caution and patience are key.
Dogecoin (DOGE) , the most recognized meme coin in the crypto market, has experienced a notable rally in early May 2025. However, its recent price action now shows signs of cooling off. A detailed analysis of the daily and hourly TradingView charts reveals crucial price levels, moving average signals, and Fibonacci projections that suggest where DOGE price might head next .
Dogecoin Price Prediction: What Do the Dogecoin Daily Charts Reveal?
DOGE/USD Daily Chart- TradingView
On the daily chart, Dogecoin price is currently trading at around $0.2269 , showing a decline of over 3% in the last 24 hours. Despite this pullback, DOGE recently achieved a significant breakout above its multi-month descending trendline. This momentum allowed it to reclaim the 50-day simple moving average (SMA) positioned near $0.1955, which is now acting as a strong base support.
DOGE price recent push saw it rally from below $0.16 to as high as $0.26 before facing resistance. The 200-day SMA, now located at $0.2668, appears to be the major resistance zone capping any further upside. This level has rejected the price twice already, indicating that bulls are currently struggling to break through the longer-term trend barrier. The Fibonacci retracement also adds weight to this region, with the 0.382 level around $0.22 now acting as a support line amid the consolidation.
What’s Happening on the Hourly Chart?
DOGE/USD 1 Hr Chart- TradingView
Zooming into the hourly chart, the sharp upward move that began around May 8 has started to lose steam. Dogecoin price reached a local high near $0.26 but has since entered a consolidation zone between $0.22 and $0.23. The moving averages on this timeframe are starting to flatten, suggesting that the immediate bullish momentum is fading.
At present, the price is hovering around $0.227. The 20-hour and 50-hour SMAs are tightly packed just above the current price, and the hourly candles are showing indecision. This reflects a balance between buyers and sellers. However, volume is tapering off, indicating that traders are waiting for a decisive move before taking fresh positions. If DOGE breaks below $0.226, a retest of the $0.223 to $0.220 zone is highly probable, which would also align with the lower support of the moving average ribbon.
Is There Still Upside for DOGE in May 2025?
To evaluate DOGE’s potential upward targets, we apply the Fibonacci extension tool using the recent impulse wave from approximately $0.15 to $0.26. The current consolidation level around $0.23 corresponds to the 0.236 retracement level, which often acts as a key decision point. If DOGE manages to hold this zone and push higher, the next technical targets will be $0.24, $0.27, and potentially even $0.30.
For Dogecoin price to make a move toward the $0.30 level , it must first decisively break through the 200-day SMA resistance at $0.2668. This would require a resurgence in volume and broader market support. A daily candle close above $0.24 would be the first signal of strength, and a close above $0.27 would likely trigger further buying pressure. On the flip side, if the $0.22 support fails, DOGE could revisit $0.195 or even test the 100-day SMA near $0.1750.
Dogecoin Price Prediction: Bullish or Bearish?
From a technical standpoint, Dogecoin price still holds a bullish structure , but the momentum is weakening. A break above $0.24 would open up the path toward $0.27 and $0.30, representing roughly a 32% upside from the current price.
However, if the price dips below $0.22, the bullish scenario would be invalidated, and bears may push it back toward the $0.195 support level.
Final Thoughts: Should You Buy the Dip?
Dogecoin’s recent run-up has injected new life into its price chart, but now it stands at a technical crossroads. The bullish breakout is still intact, provided DOGE continues to trade above the $0.22–$0.20 range. Traders and investors should keep a close watch on whether DOGE can reclaim $0.24 with volume support. If it does, the path toward $0.27 and beyond remains open. However, failure to hold key support levels could lead to a deeper correction.
For now, the DOGE price remains in a healthy consolidation phase , and accumulation within this range could precede the next big move. If sentiment across the crypto market turns favorable again, DOGE might surprise traders with another impulsive wave. But until that happens, caution and patience are key.
Disclaimer: The content of this article solely reflects the author's opinion and does not represent the platform in any capacity. This article is not intended to serve as a reference for making investment decisions.
You may also like
The Great Debate on AI Bottlenecks: 2027 Peak Bottleneck vs 2028 Capacity Boom and Price Collapse
Analyst Ben Bajarin believes that the demand for AI computing power will continue to grow, and 2027 will be the "bottleneck" year with the most severe industry-wide supply constraints. In 2028, supply and demand are expected to remain slightly tight but balanced. Jay Goldberg, on the other hand, warns that the historical cycle's iron law suggests that massive production capacity from companies like TSMC could lead to a collapse in pricing power and a reversion of profit margins to the mean. Both agree that the era of "blindly buying into the AI supply chain and seeing instant surges" has ended, and investors must now carefully select core assets with resilience in cross-cycle pricing.
Japan Is Dragging the World Down
Japan's government bond yields have surpassed 3% for the first time in 30 years, triggering global alarm. Nomura states that the epicenter of this global rise in long-term interest rates is within Japan itself—driven by uncontrolled fiscal expansion and expectations of central bank rate hikes, making fiscal risk premiums the main driving force. What’s more concerning to the market is that the continuous rise in Japanese bond yields not only threatens the balance sheets of global financial institutions, but may also burst the AI tech stock bubble and trigger a sudden economic slowdown.
Australian Dollar weakens to near 0.7200 as traders await US PPI inflation data

Crypto prices
More


