
XRP News: Don’t Miss This XRP Rally

Ripple’s XRP is showing renewed strength on the charts, with bullish momentum accelerating both in the short term and on the daily timeframe. Based on the current TradingView hourly and daily charts, here’s a full breakdown of where XRP stands and what could be next.
XRP Price Prediction: What Is XRP Doing Right Now?
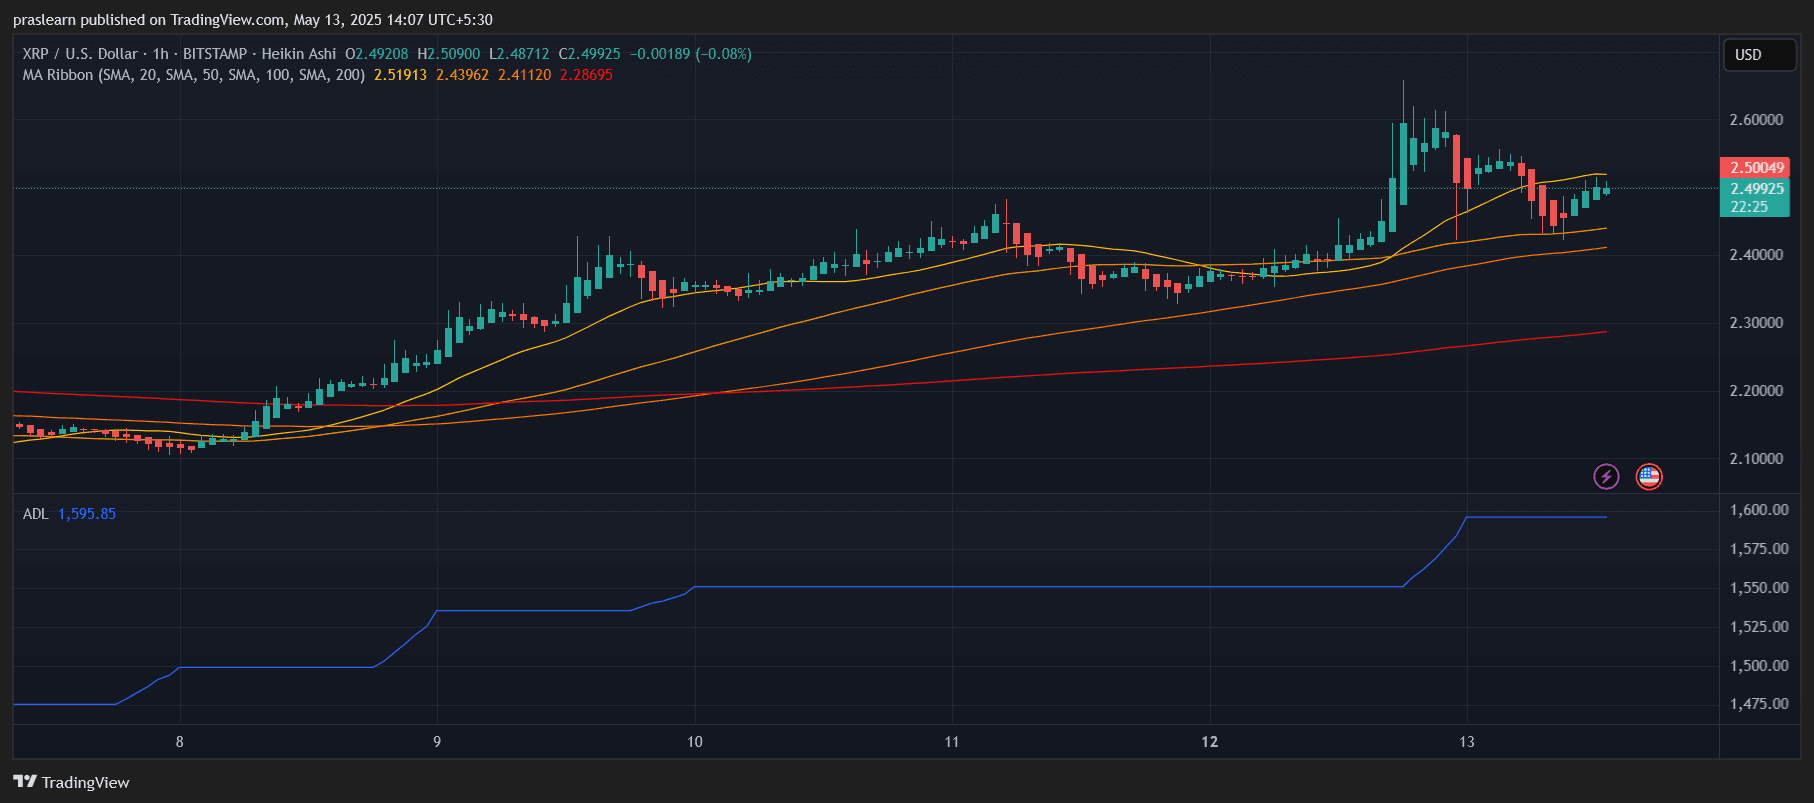 XRP/USD 1 Hr Chart- TradingView
As of May 13, 2025, XRP is trading near $2.50 , showing a solid uptrend supported by multiple moving averages. The daily chart shows XRP bouncing from the $2.10 range and breaking past several key resistances. On the hourly chart, XRP price is maintaining price action above all major short-term moving averages, signaling strong intraday momentum.
Is XRP in a Bullish Trend?
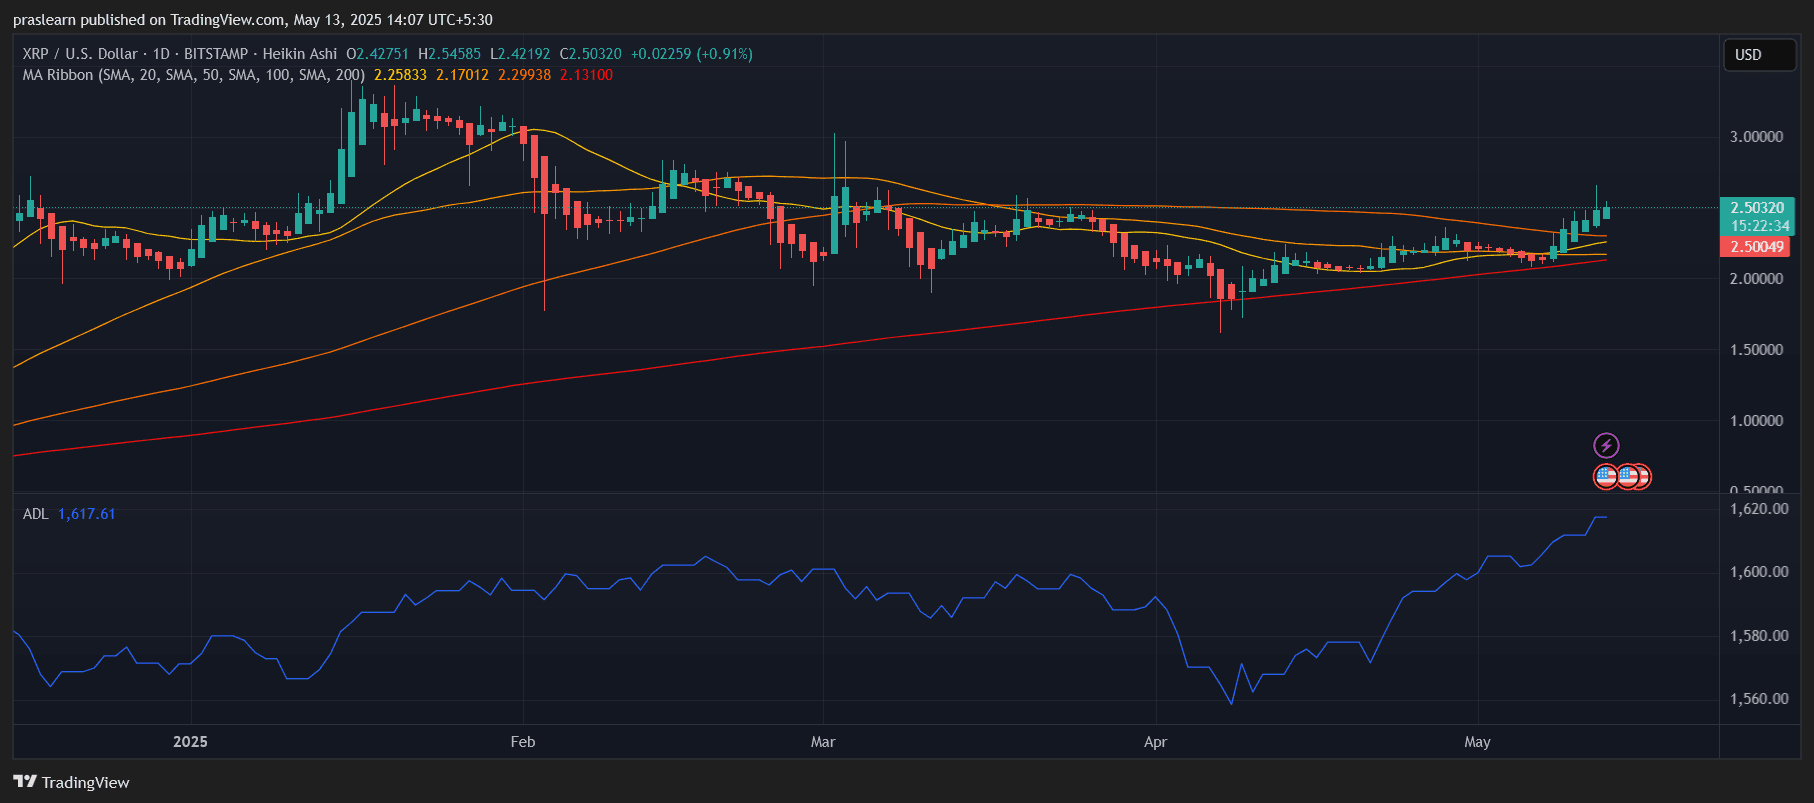 XRP/USD Daily Chart- TradingView
Yes, both timeframes confirm a bullish structure:
- Daily Chart: XRP price is trading above the 20-day ($2.26) , 50-day ($2.17), 100-day ($2.30), and 200-day ($2.13) simple moving averages. This alignment of shorter MAs above longer MAs is a classic bullish signal.
- Hourly Chart: Price remains above the 20-SMA ($2.52), 50-SMA ($2.44), 100-SMA ($2.41), and 200-SMA ($2.28), which indicates strong buyer support even during minor dips.
These alignments suggest both long-term holders and short-term traders are optimistic.
What Do the Accumulation/Distribution Lines Say?
The ADL (Accumulation/Distribution Line) on both charts is steadily rising—up to 1,617 on the daily and 1,595 on the hourly. This indicates consistent accumulation rather than distribution, meaning whales and institutions are likely buying, not selling.
Key Support and Resistance Levels
Based on the charts:
- Immediate resistance: $2.55 – previous intraday high.
- Major resistance: $2.75 and $3.00 – psychological barrier and previous February high.
- Key support: $2.30 (aligned with 100-SMA), then $2.10 (prior swing low).
A sustained breakout above $2.55 could trigger a rally to test the $3.00 level.
XRP Price Prediction: Where Could It Go Next?
Let’s run a Fibonacci extension from the swing low ($2.10) to the recent top near $2.55:
- 0.618 extension: ~$2.75 (likely next resistance)
- 1.0 extension: ~$3.00 (psychological round number)
- 1.618 extension: ~$3.35 (possible breakout target)
Given the bullish crossover of moving averages, the rising ADL, and growing volume, XRP has room to push higher if it holds above $2.30.
Short-Term Trade Idea
If you're considering a short-term trade:
- Buy Zone: $2.40–$2.45 (near 50- and 100-hour SMA)
- Target: $2.75 (first), $3.00 (next)
- Stop-loss: Below $2.30
This offers a favorable risk/reward ratio of about 1:2.5 if targeting $3.00 from a $2.45 entry.
Final Thoughts: Will XRP Explode in 2025?
The charts are aligning for a strong bullish continuation. With XRP price showing strength above its major moving averages, positive accumulation, and bullish sentiment on both hourly and daily timeframes, a break above $2.55 could spark the next leg toward $3.00 and beyond. However, traders should watch closely for volume confirmation and macro news, especially regarding SEC developments or Ripple partnerships.
XRP is not just holding the line — it’s getting ready to charge.
Ripple’s XRP is showing renewed strength on the charts, with bullish momentum accelerating both in the short term and on the daily timeframe. Based on the current TradingView hourly and daily charts, here’s a full breakdown of where XRP stands and what could be next.
XRP Price Prediction: What Is XRP Doing Right Now?
XRP/USD 1 Hr Chart- TradingView
As of May 13, 2025, XRP is trading near $2.50 , showing a solid uptrend supported by multiple moving averages. The daily chart shows XRP bouncing from the $2.10 range and breaking past several key resistances. On the hourly chart, XRP price is maintaining price action above all major short-term moving averages, signaling strong intraday momentum.
Is XRP in a Bullish Trend?
XRP/USD Daily Chart- TradingView
Yes, both timeframes confirm a bullish structure:
- Daily Chart: XRP price is trading above the 20-day ($2.26) , 50-day ($2.17), 100-day ($2.30), and 200-day ($2.13) simple moving averages. This alignment of shorter MAs above longer MAs is a classic bullish signal.
- Hourly Chart: Price remains above the 20-SMA ($2.52), 50-SMA ($2.44), 100-SMA ($2.41), and 200-SMA ($2.28), which indicates strong buyer support even during minor dips.
These alignments suggest both long-term holders and short-term traders are optimistic.
What Do the Accumulation/Distribution Lines Say?
The ADL (Accumulation/Distribution Line) on both charts is steadily rising—up to 1,617 on the daily and 1,595 on the hourly. This indicates consistent accumulation rather than distribution, meaning whales and institutions are likely buying, not selling.
Key Support and Resistance Levels
Based on the charts:
- Immediate resistance: $2.55 – previous intraday high.
- Major resistance: $2.75 and $3.00 – psychological barrier and previous February high.
- Key support: $2.30 (aligned with 100-SMA), then $2.10 (prior swing low).
A sustained breakout above $2.55 could trigger a rally to test the $3.00 level.
XRP Price Prediction: Where Could It Go Next?
Let’s run a Fibonacci extension from the swing low ($2.10) to the recent top near $2.55:
- 0.618 extension: ~$2.75 (likely next resistance)
- 1.0 extension: ~$3.00 (psychological round number)
- 1.618 extension: ~$3.35 (possible breakout target)
Given the bullish crossover of moving averages, the rising ADL, and growing volume, XRP has room to push higher if it holds above $2.30.
Short-Term Trade Idea
If you're considering a short-term trade:
- Buy Zone: $2.40–$2.45 (near 50- and 100-hour SMA)
- Target: $2.75 (first), $3.00 (next)
- Stop-loss: Below $2.30
This offers a favorable risk/reward ratio of about 1:2.5 if targeting $3.00 from a $2.45 entry.
Final Thoughts: Will XRP Explode in 2025?
The charts are aligning for a strong bullish continuation. With XRP price showing strength above its major moving averages, positive accumulation, and bullish sentiment on both hourly and daily timeframes, a break above $2.55 could spark the next leg toward $3.00 and beyond. However, traders should watch closely for volume confirmation and macro news, especially regarding SEC developments or Ripple partnerships.
XRP is not just holding the line — it’s getting ready to charge.
Disclaimer: The content of this article solely reflects the author's opinion and does not represent the platform in any capacity. This article is not intended to serve as a reference for making investment decisions.
You may also like
US Diesel Faces a “Perfect Storm” of Rate Hikes and Midterm Elections! EIA Warning: Demand Peak Not Yet Reached, Prices Hit New High, Inventory Drops to Lowest Level in 23 Years
US diesel inventories are expected to fall to their lowest level since 2003 before peak demand arrives.

Ford Publicly Hits Back at US Secretary of Transportation, US Auto Industry "Fighting to Preserve Electric Vehicles"
The U.S. Secretary of Transportation is pressuring to cut off cooperation with Chinese companies such as CATL. Ford criticized Secretary Buttigieg for "overstepping" and being "factually incorrect," citing positive statements from the White House and the Department of Commerce as evidence that Buttigieg does not represent the official government position. The core conflict lies in the fact that U.S. carmakers' transition to electrification is highly dependent on Chinese battery technology. Severing cooperation would force them back into the shrinking fuel vehicle market, putting the policy goals of manufacturing reshoring and electrification upgrades in a dilemma.
"The Most Unsexy Investment Strategy" is Timely! As Bonds Collapse and Stocks Soar, Investors Face a Great Opportunity for Rebalancing
Financial advisors indicate that, amid global bond sell-offs, stock markets hovering near historic highs, and investors facing geopolitical uncertainties, now may be an especially suitable time to consider portfolio rebalancing.

They boosted the Yen but failed to hold U.S. Treasury bonds! Is Basent a "weak teammate" for U.S. stocks?
This week, Besant made high-profile calls to suppress yen short positions and raised the US Treasury repo limit to $6 billion. As a result, the yen strengthened, but US Treasuries declined—10-year yields hit their highest level since October 2023, and 30-year yields approached a twenty-year peak. Analysts noted that the combination of a stronger yen and rising US Treasury yields is simultaneously impacting carry trades and stock valuations, posing a dual threat to the US stock market bull run. This is described as "the greatest risk facing the bull market."
Crypto prices
More


