
Hedera (HBAR) Struggles to Build Bullish Pattern in Tight Range

Hedera (HBAR) has fallen over 6% in the last seven days as key indicators point to shifting momentum. After 10 days of bullish strength, the BBTrend has turned negative at -3.35, suggesting growing downside risk.
Meanwhile, the RSI has rebounded to 49.82 but remains below the critical 50 mark, signaling indecision. With HBAR trading in a tight range between $0.1849 and $0.189, a breakout in either direction could define the next trend.
HBAR BBTrend Turns Negative After 10-Day Run
Hedera’s BBTrend has just flipped negative after holding above zero for 10 consecutive days, suggesting a potential shift in momentum.
Currently, the BBTrend stands at -3.35, a sharp contrast from the bullish tone seen earlier this month. This reversal occurred two days ago and may reflect weakening upward pressure on HBAR’s price.
After showing consistent strength, the recent change raises caution among traders watching for early signs of a downtrend.
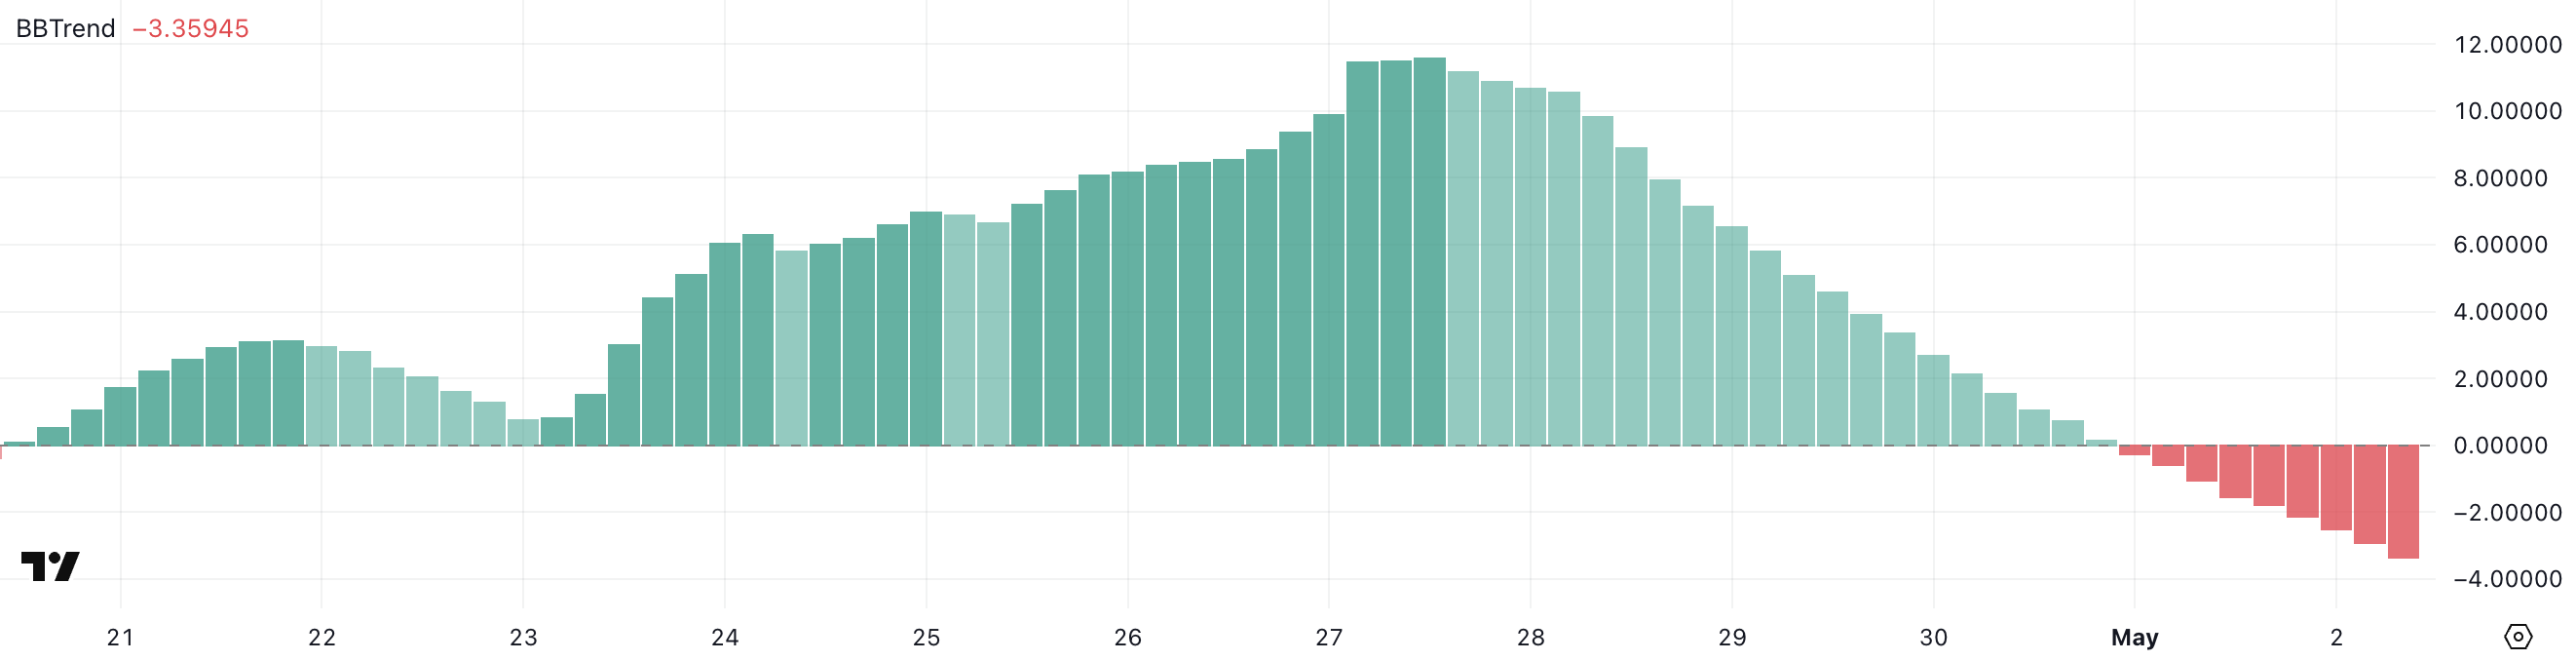
BBTrend, or Bollinger Band Trend, is a momentum indicator that measures price distance and direction relative to the Bollinger Bands.
When the BBTrend is above zero, it typically reflects strong bullish momentum, indicating the price is pushing toward or staying near the upper band. When it moves below zero, as it has now for HBAR, it often suggests growing bearish sentiment, with the price leaning toward the lower band.
A reading like -3.35 points to increased volatility and the potential for further downside, especially if other indicators begin aligning with this weakening signal.
Hedera RSI Rebounds but Stays Below Key Bullish Zone
Hedera’s RSI is currently at 49.82, rebounding from 42.45 yesterday after briefly touching 54 earlier in the session. This bounce suggests some recovery in buying interest, but the RSI remains below the key 50 threshold.
The recent movement indicates a tug-of-war between bulls and bears, with no clear dominance yet.
After sliding earlier in the week, this slight uptick could reflect a potential shift toward stabilization.
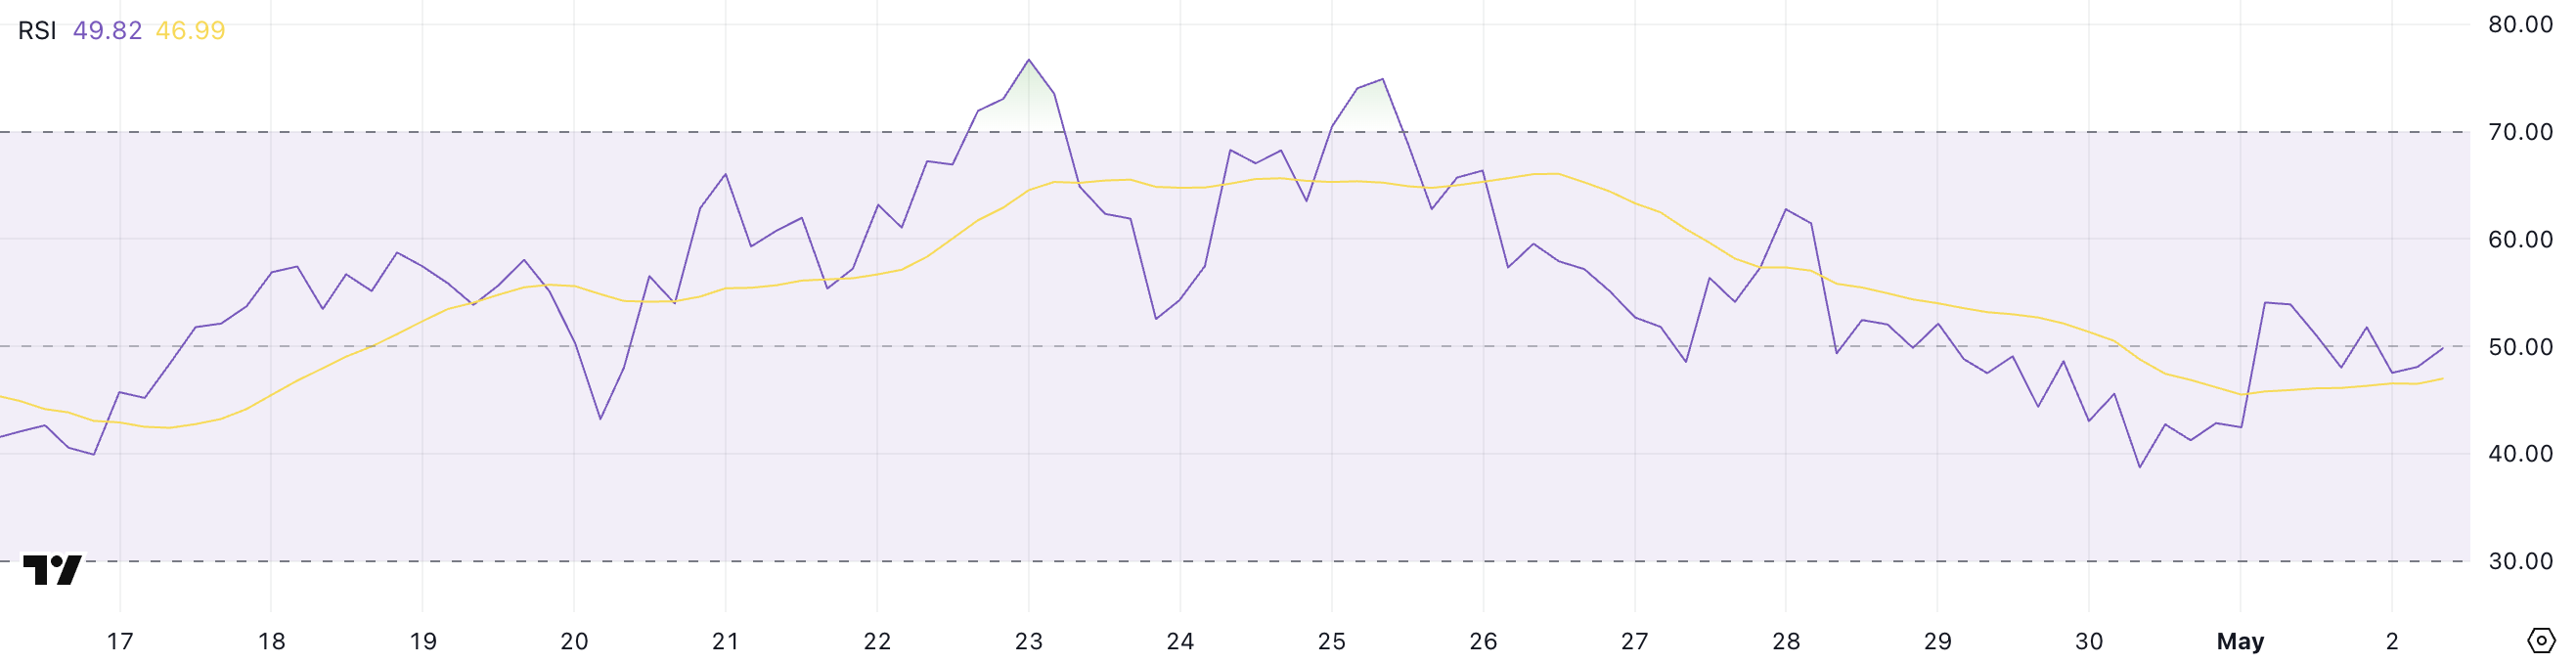
The Relative Strength Index (RSI) is a momentum oscillator that ranges from 0 to 100, used to assess overbought and oversold conditions.
Readings above 70 typically indicate an asset is overbought and may be due for a correction, while values below 30 suggest oversold conditions and a possible rebound. Levels between 30 and 70 are considered neutral, with 50 as a pivot point.
HBAR’s current RSI of 49.82 places it right on that line, signaling indecision, though the recent rise hints that momentum could tilt bullish if it breaks above 50 and holds.
Hedera Consolidates—Will Bulls or Bears Take Control?
Hedera price is trading in a tight range between resistance at $0.189 and support at $0.1849, with other key levels close by. If the $0.189 resistance breaks, it could open the door for a move toward $0.199 and $0.202.
A sustained uptrend could push HBAR to retest the $0.258 level, marking a significant bullish breakout.
For now, price action remains cautious as the market waits for a decisive move.
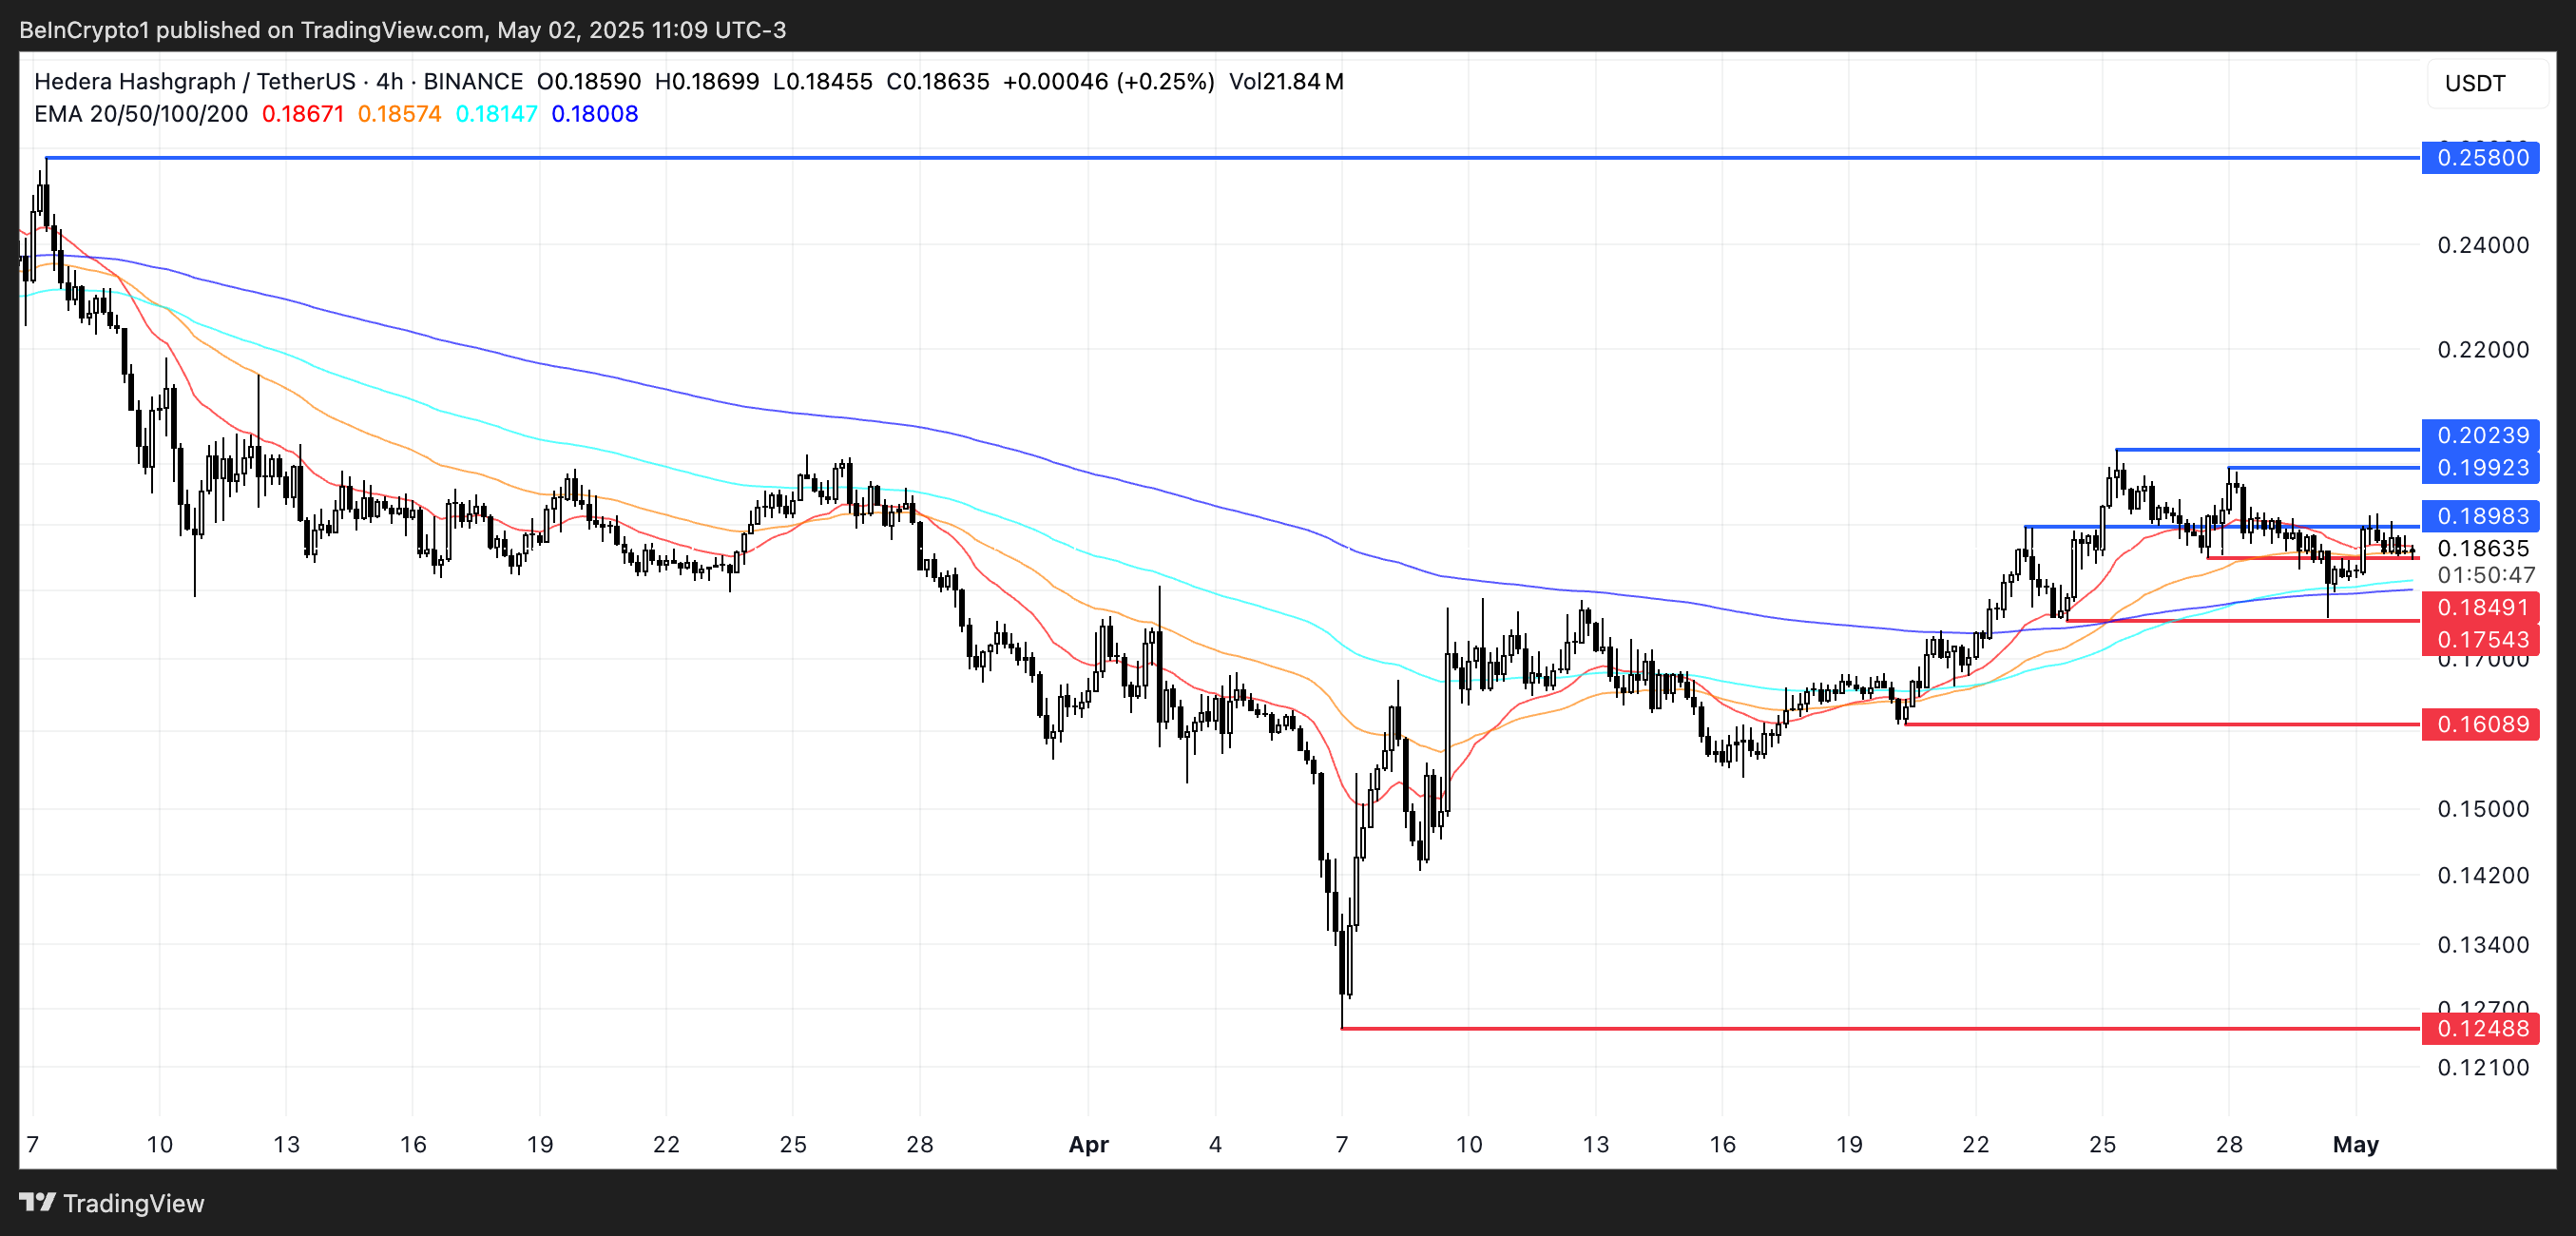
On the downside, if the $0.1849 support is broken, HBAR may fall toward $0.175 and $0.16.
A deeper downtrend could drag it as low as $0.124, erasing much of its recent gains. These levels represent critical turning points, and traders will watch closely for volume spikes or momentum shifts.
Until then, Hedera remains in consolidation, with pressure building on both sides.
Disclaimer: The content of this article solely reflects the author's opinion and does not represent the platform in any capacity. This article is not intended to serve as a reference for making investment decisions.
You may also like
After the investor frenzy subsides, the Korean stock market falls into a stalemate! Trading volume drops to a yearly low, struggling to hold the 7,000-point threshold
As investor enthusiasm gradually wanes, the trading volume of the Korean stock market has dropped to its lowest level this year, indicating that the AI-driven Korean stock market may find it difficult to return to previous highs.

Under Trump's tariff pressure, "banding together for warmth"? EU proposes making Canada the first "associate member country"
European Commission President Ursula von der Leyen has proposed that Canada become the EU's first "quasi-member state."

Chainlink trades at $11.28 as LINK eyes breakout above $11.50 resistance
"The Big Short" Burry: Cracks appear in the US housing market, still betting on Fannie Mae (FNMA.US) and Freddie Mac (FMCC.US)
Share prices of Fannie Mae (FNMA.US) and Freddie Mac (FMCC.US) have plunged, but "The Big Short" Michael Burry continues to hold shares in both companies.

Crypto prices
More


