- Ethereum stalls at $3,904, signaling resistance and potential bearish reversal.
- ETH dominance dips to 7.37%, nearing key multi-year support.
- Price holds between $1,400–$2,000, a crucial zone for trend continuation or breakdown.
Ethereum’s price structure continues to follow a familiar macro range between $1,400 and $3,900, with repeated reactions at key support and resistance levels. Momentum has faded after a failed breakout above the $3,600 mark, highlighting weakening bullish strength.
ETH Price Loses Bullish Structure Near Resistance
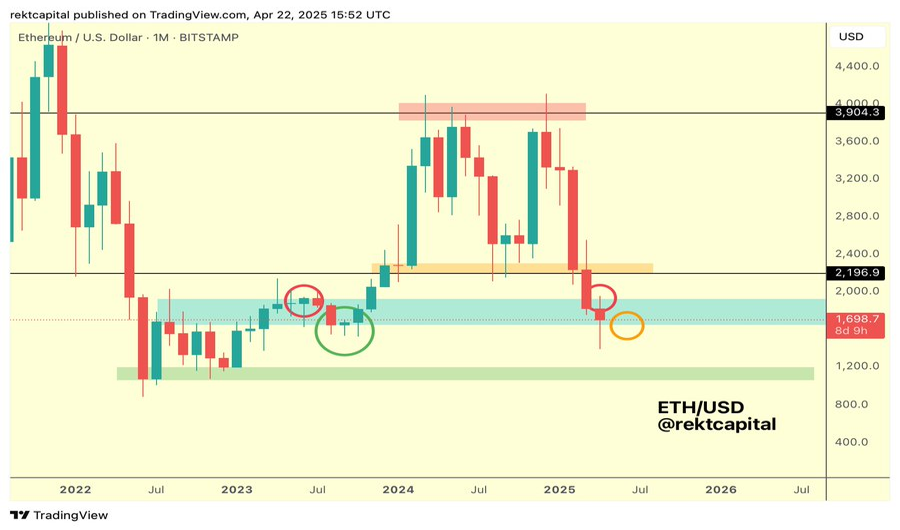
Ethereum price has ranged between major resistance at $3,904 and support near $1,400 since early 2022. The structure shows two clear rejections from the top of this range, the latest occurring in early 2024.
Rekt Capital, a widely followed crypto market analyst, has been closely monitoring Ethereum’s monthly structure and recent breakdown dynamics. He identified $3,904 as a long-standing resistance zone where the price consistently faced rejection. Multiple monthly wicks failed to break this level, forming a clear double top in early 2024.
Source: Rekt Capital
As volatility gripped the time frame, he moved to dissect short-term support structures and bearish invalidation points. By mid-2024, the price reversed from $3,600 and closed under $2,196. That candle broke below prior support and formed the basis for a bearish trend shift.
With a breakdown confirmed, he tracked Ethereum’s move back into the light blue demand zone between $1,400 and $2,000. Price briefly wicked below this zone before reclaiming it intramonth. The time frame now shows Ethereum holding near the center of this support region.
Based on the EMA alignment, he gauged momentum strength and noted the lack of bullish reversal confirmation. The orange circle marks Ethereum’s failed retest attempt, reinforcing the current bearish tone through technical signals.
Given the Fibonacci cluster, he reevaluated key bounce zones and identified the $1,400 level as crucial support. Below this, a green demand zone between $800 and $1,400 remains Ethereum’s next major technical base, supported by broader market structure.
Ethereum Dominance Retests Historical Support
Ethereum dominance has declined since 2022, retracing gains from its previous uptrend and testing a multi-year support area. Market analyst Rekt Capital provided another detailed technical analysis of Ethereum’s dominance performance. He noted that the green zone between 6% and 8% has historically served as a reversal region. In 2020, this level marked the bottom of a macro cycle before dominance surged higher.
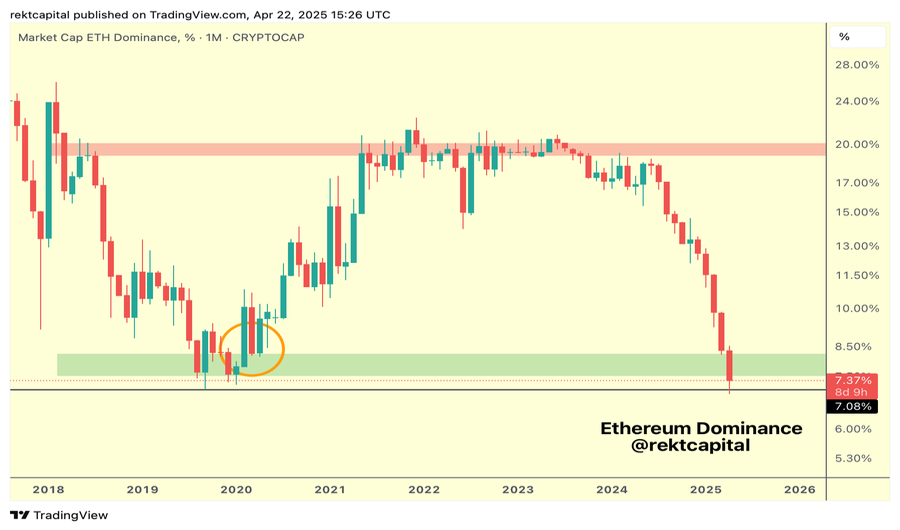
Spotting early weakness in the higher timeframe structure, he explored downside potential near the lower boundary of this green zone. Dominance currently stands at 7.37%, with a recent low of 7.08%. This places Ethereum near its 2019 support.
Tracking Ichimoku cloud behavior, he explained that trend bias remains bearish unless a close above 8% confirms renewed strength. No bullish engulfing or hammer formations are visible yet. Resistance remains capped at the 20–21% range, where repeated breakouts failed. Rekt Capital’s analysis places Ethereum at critical inflection points in both price and market dominance.