
Onyxcoin (XCN) Bullish Momentum Could Be Fading Despite 10% Weekly Gains

Onyxcoin’s technical indicators show a mixed but stabilizing outlook as it holds key support levels and eyes a potential push toward $0.024.
Onyxcoin (XCN) has risen more than 3% in the last 24 hours and nearly 12% over the past week, bringing its market cap back to around $640 million.
After a volatile week, XCN’s technical indicators show important shifts that could shape its next move. The token’s RSI, ADX, and EMA structures all suggest a mix of stabilizing momentum and caution signs. Here’s a closer look at the current setup for Onyxcoin heading into the first week of May.
Onyxcoin RSI Bounces Back, Setting Neutral Stage for Next Move
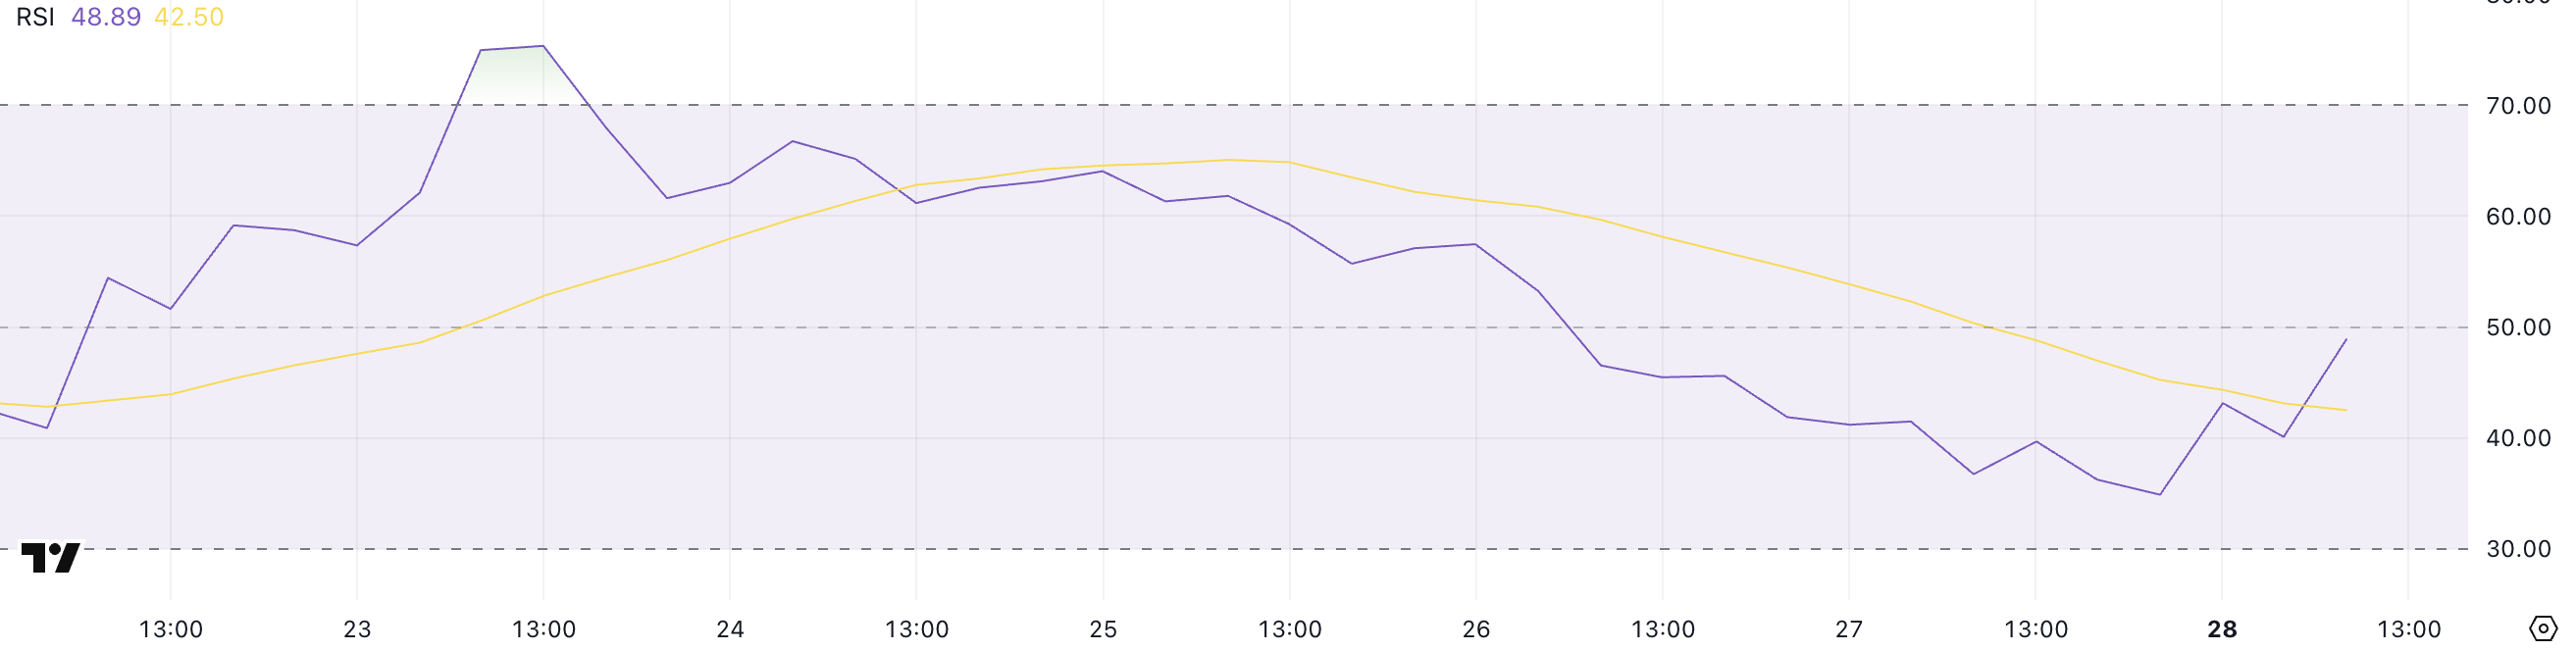
Onyxcoin’s Relative Strength Index (RSI) is currently at 48.89, after reaching as high as 75 just five days ago. The RSI had fallen sharply to 34.88 yesterday but has since recovered, suggesting that selling pressure may be easing.
This recent bounce shows momentum is trying to stabilize, although the token remains well below the recent overbought zone it touched earlier in the week.
The shift also signals that Onyxcoin is no longer close to oversold territory, but has yet to show a clear direction for its next major move.
 XCN RSI. Source:
TradingView.
XCN RSI. Source:
TradingView.
The RSI is a widely used technical indicator that measures the speed and magnitude of an asset’s recent price movements to assess whether it is overbought or oversold.
Typically, an RSI above 70 indicates overbought conditions and potential for a pullback, while an RSI below 30 signals oversold conditions and potential for a rebound.
With XCN’s RSI now sitting at 48.89, the token is in a neutral zone, providing room for further upside if positive momentum continues. If buying pressure increases from here, XCN could build a stronger recovery without immediately facing technical resistance from overbought conditions.
XCN Uptrend Remains, But Trend Strength Weakens
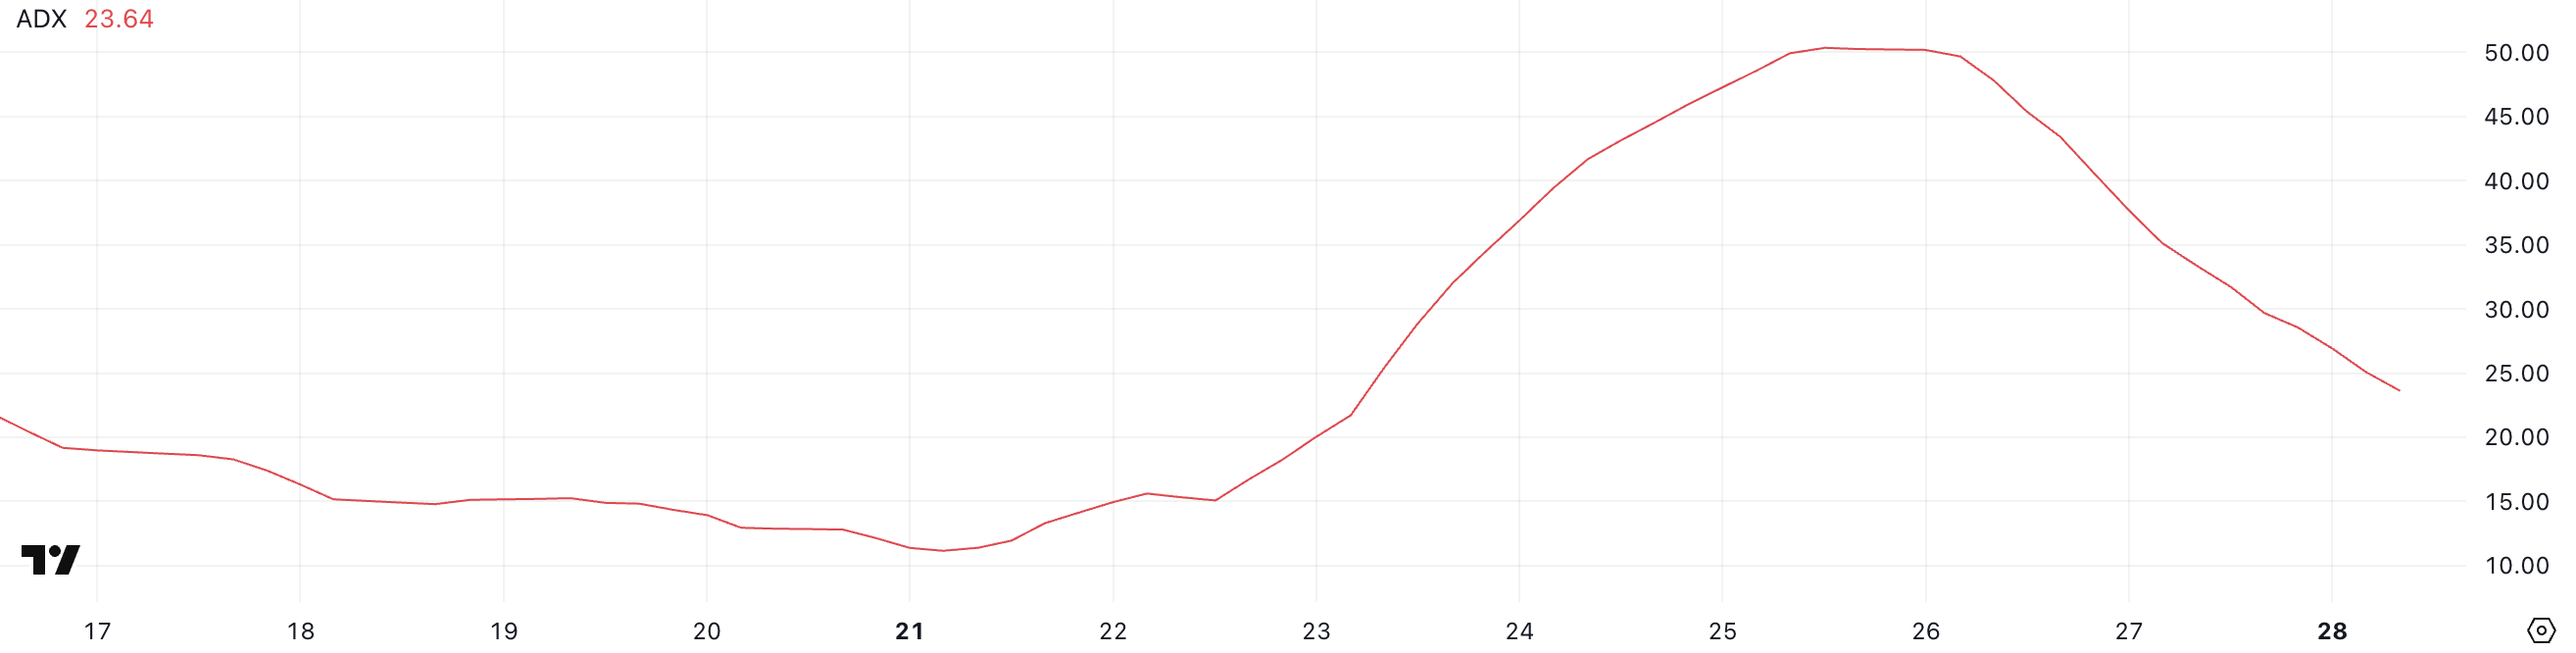
Onyxcoin Average Directional Index (ADX) is currently at 23.64, a significant drop from the 50 level it reached just two days ago.
This sharp decrease suggests that the strength of the recent trend has weakened, even though Onyxcoin remains technically in an uptrend.
The decline in ADX reflects a cooling in momentum after a strong directional move earlier in the week. While the uptrend is still intact, the lower ADX reading signals that the trend’s strength is no longer as dominant as it was a few days ago.
 XCN ADX. Source:
TradingView.
XCN ADX. Source:
TradingView.
The ADX is a technical indicator that measures a trend’s strength, but not the direction. Values above 25 typically suggest a strong trend, while values below 20 point to a weak or directionless market.
With XCN’s ADX now sitting at 23.64, the trend is still moderately strong but close to losing strength if the reading continues to fall.
This means that while Onyxcoin’s uptrend remains, it may require renewed buying pressure soon to avoid slipping into a period of consolidation or sideways movement.
Onyxcoin Holds Support, But EMA Gap Signals Caution
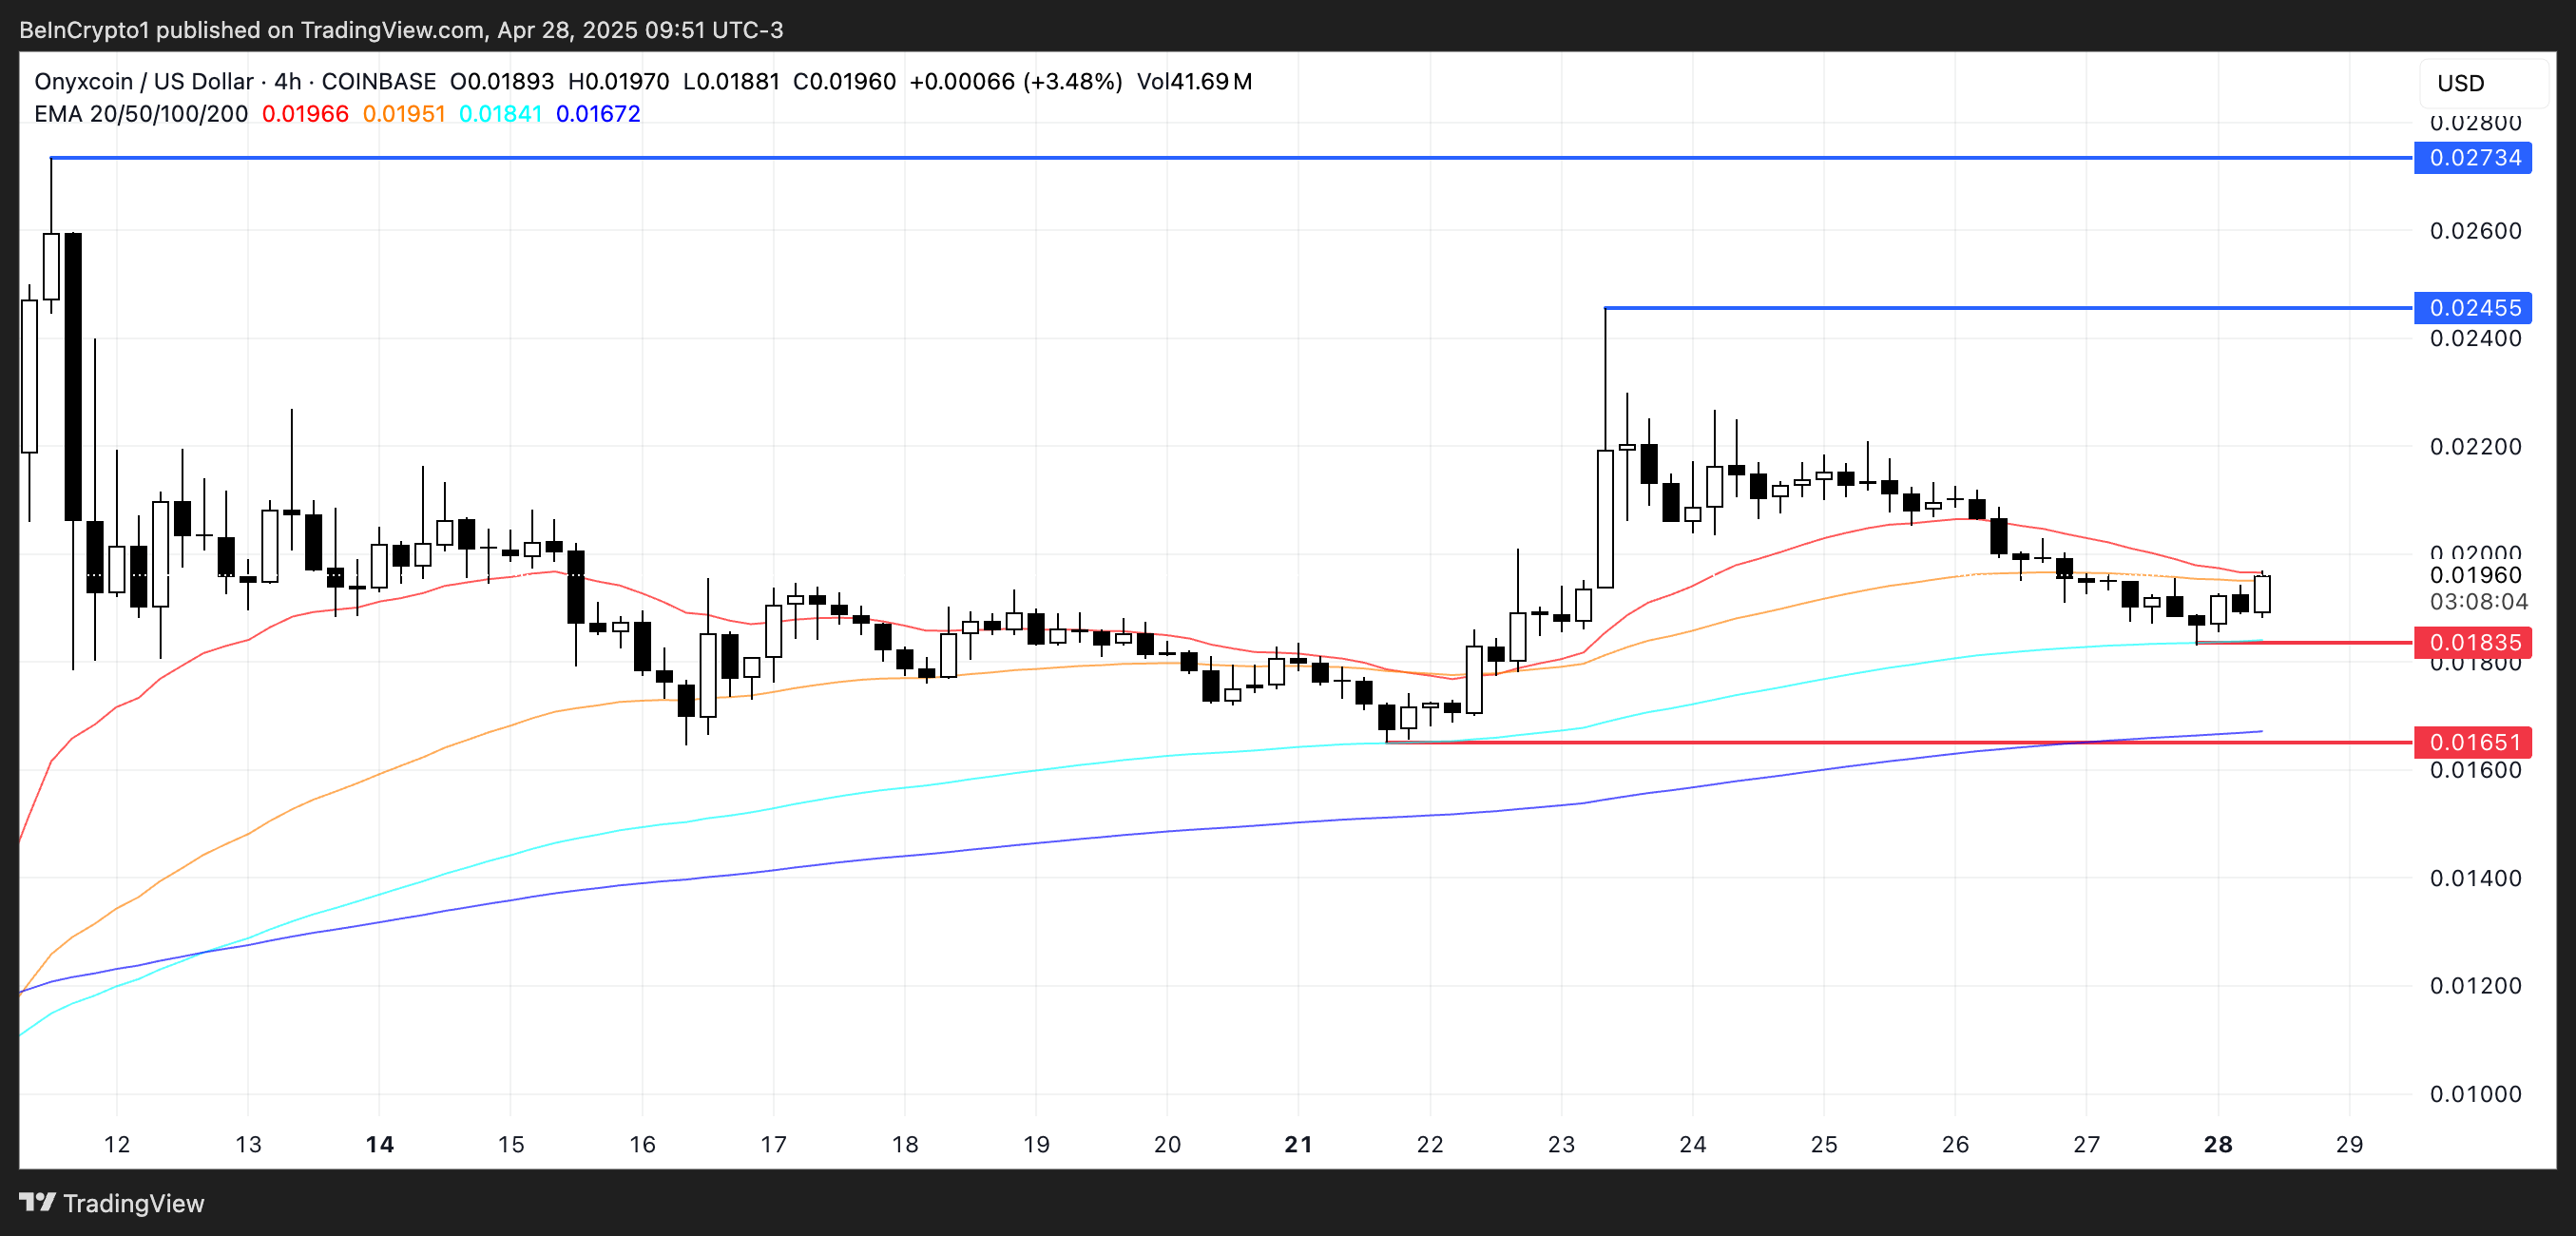
XCN gained around 112% in April, making it one of the best-performing altcoins for the month. Its Exponential Moving Average (EMA) lines remain bullish, with the short-term EMAs still positioned above the long-term ones.
However, the gap between the short-term and long-term EMAs has narrowed compared to previous days, indicating that the bullish momentum is losing some strength.
While the general trend remains positive, the shrinking distance between the EMAs suggests that the market is approaching a critical point where a clearer direction could soon emerge.
 XCN Price Analysis. Source:
TradingView.
XCN Price Analysis. Source:
TradingView.
In the last few days, Onyxcoin successfully tested and held the support zone around $0.018, but this level remains fragile.
If XCN tests this support again and fails to hold it, the price could drop toward the next support near $0.016. On the upside, if buying momentum returns, XCN could rally to test the $0.024 resistance.
A breakout above $0.024 could open the door for a continuation toward $0.027, offering a strong bullish setup if momentum strengthens.
Disclaimer: The content of this article solely reflects the author's opinion and does not represent the platform in any capacity. This article is not intended to serve as a reference for making investment decisions.
You may also like
The 5% U.S. Treasury yield storm is coming! The refinancing time bomb countdown begins—who will be the first victim?
The 10-year US Treasury yield has surpassed 5%, reaching a new high since 2007. The longer high interest rates persist, the greater the refinancing pressure will be on real estate companies, commercial real estate, and highly indebted firms, with systemic risks likely to accelerate and emerge within the next 12 to 18 months.

Don't Fight the Profit Cycle! Will U.S. Stocks Break 8,000 Points This Year?
Jefferies predicts that, driven by the dual engines of the AI investment boom and stronger-than-expected corporate earnings, the S&P 500 index is expected to soar to 8,000 points by the end of 2026 and further reach 9,000 points in 2027. AI-driven profit expansion has spread from the "Magnificent Seven" to the entire market, with the S&P 500's EPS forecast to surge by 35% this year, far exceeding market consensus—marking the strongest earnings supercycle since 1995! The only real threat: if US Treasury yields continue to spike, the risk of valuation compression cannot be ignored.
Will “continual learning” AI extend the memory “shortage” until 2031?
Citi believes that as AI enters the era of "continuous learning" beyond simple training and inference stages, demand for HBM, server DDR5, and enterprise SSDs (eSSD) will experience explosive and simultaneous growth starting from 2027. While demand will surge rapidly, the supply side is constrained by HBM production capacity usage and slower technology migration, leading to expansion lagging far behind demand. This supply-demand imbalance is expected to continue until 2031.
Crypto prices
More


