
Will TRX Finally Break $0.25?

TRON (TRX) might not be dominating headlines, but its recent chart behavior says something is brewing beneath the surface. After weeks of tight consolidation, TRX is testing key resistance levels that could trigger the next major move. With on-chain momentum picking up and price hugging crucial moving averages, traders are starting to wonder — is TRON price about to wake up?
Let’s take a closer look at what the charts are revealing right now.
TRON Price Prediction: A Slow Grind Toward the Breakout Zone
 TRX/USD Daily Chart- TradingView
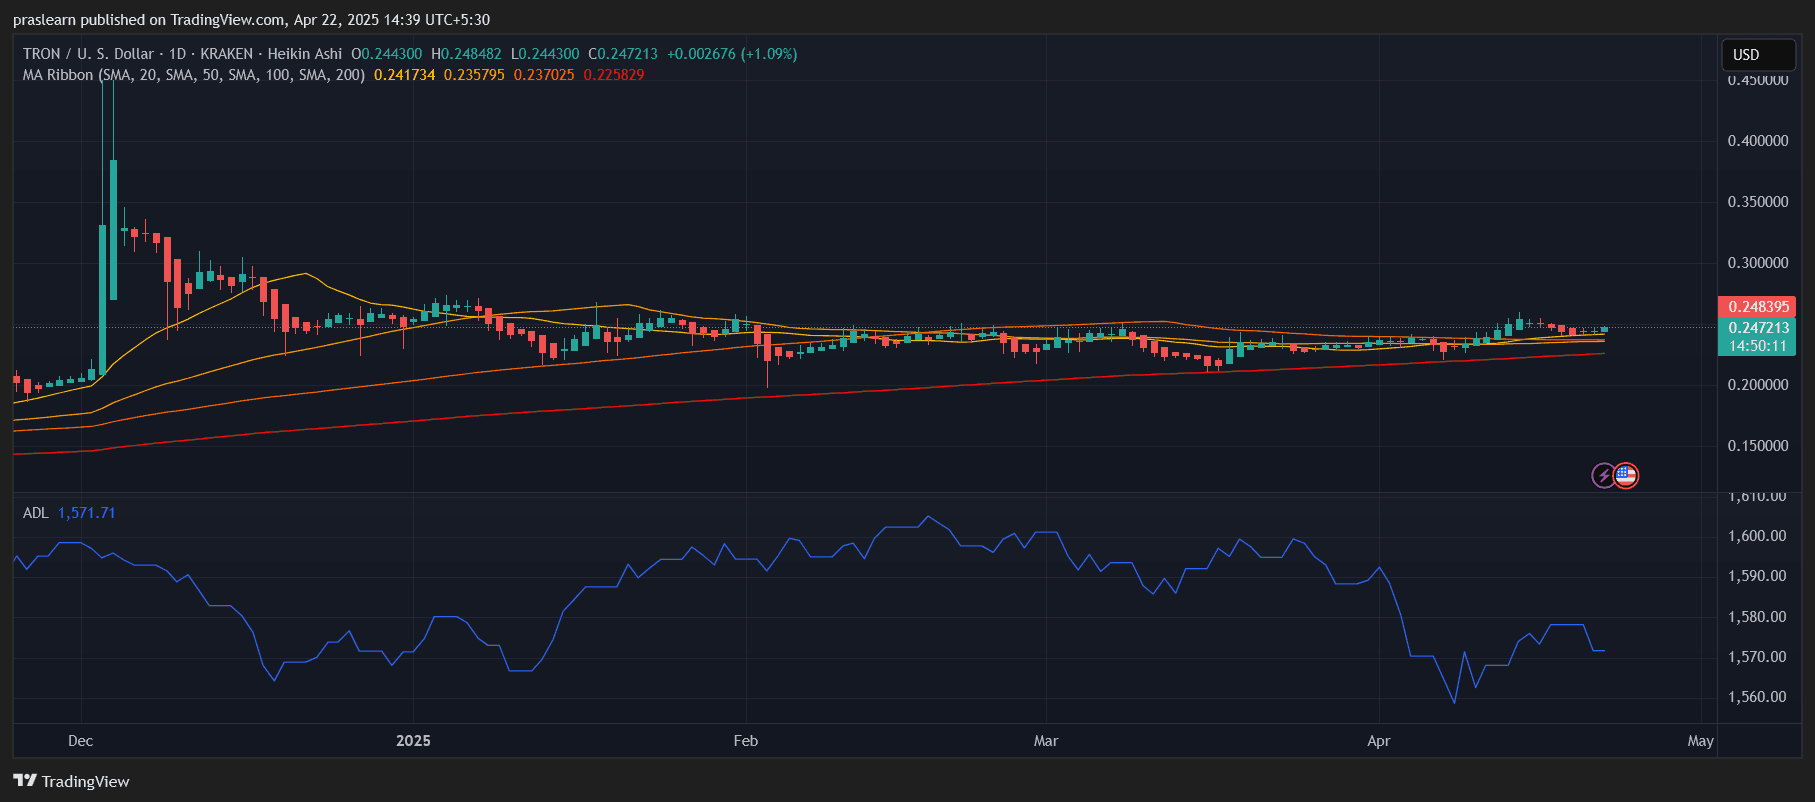
On the daily chart, TRX has been moving in an incredibly tight range , floating between $0.235 and $0.248 for most of April. This sideways action, while frustrating for traders, has served a critical purpose: it’s allowed TRON to base itself above the 200-day simple moving average (SMA), now sitting at $0.225. That’s a bullish sign of longer-term strength.
TRON Price is currently testing resistance at $0.248 , just under the 20-day SMA ($0.2417) and 50-day SMA ($0.2357). With the 100-day SMA now sitting at $0.2370 and the moving averages flattening, a crossover may be setting up in TRX’s favor. Momentum appears to be quietly shifting — and the Accumulation/Distribution Line (ADL), sitting at 1,571.71, is starting to recover from its April dip.
Hourly Chart Shows Pressure Building
 TRX/USD ! Hr Chart- TradingView
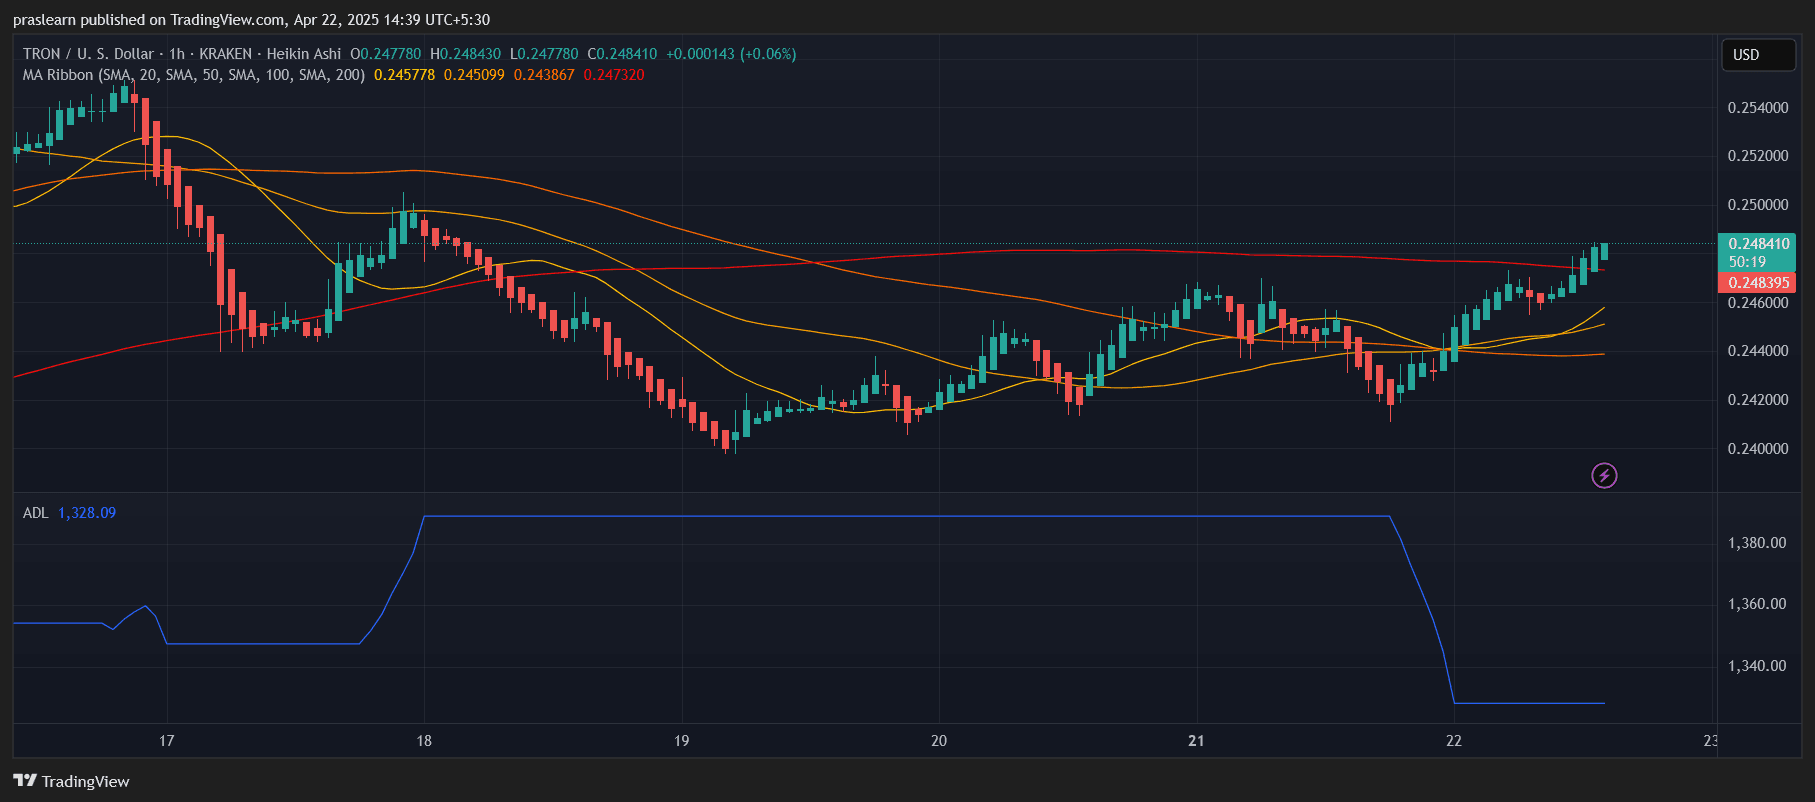
The hourly chart is more energetic. TRX price recently reclaimed its 200-hour SMA and is now printing consistent green candles just under $0.248. A breakout above this level, if paired with volume, could push price toward the $0.255–$0.260 range quickly.
What stands out is how cleanly TRX price has moved above all short-term moving averages (20, 50, 100-hour), with the hourly ADL rising to 1,328.09. This suggests that the recent rally isn’t just retail-driven — there's sustained accumulation from larger hands taking place.
If bulls can push through $0.25 and confirm a breakout, it would break the consolidation pattern that’s capped TRX for nearly a month.
What’s Driving the Quiet Strength?
TRON's lack of hype could actually be its strength. While other altcoins have suffered from speculative boom-bust cycles, TRX has steadily maintained technical support and has continued expanding its ecosystem — especially in the DeFi and stablecoin sectors across Asia.
With market focus shifting back to solid Layer 1s and utility-driven projects, TRON might be positioned for a catch-up rally. The consistent hold above the 200-day SMA supports this narrative, and technicals suggest bulls are slowly but surely regaining control.
TRON Price Prediction: What Happens Next?
If TRON price successfully closes above $0.25 on the daily timeframe, the next resistance levels are $0.265 and $0.278 — both of which acted as key rejection points earlier this year. Breaking above $0.278 would open up space for a run toward $0.30, a level that hasn't been tested since early January.
However, failure to break and hold above $0.25 could send TRX price back to retest its support near $0.237 or even the 200-day SMA at $0.225. The next 48 hours will be crucial for confirming whether this rally has real legs.
Final Thoughts: A Sleeper Altcoin Gearing Up?
TRON isn’t the flashiest coin in the market, but its technical setup looks healthier than most. With price holding above major moving averages, volume gradually increasing, and accumulation picking up again, the foundation for a larger breakout is forming.
While the market watches other trendier tokens, TRX price may be the quiet underdog getting ready to surprise everyone. If it breaks past $0.25 with conviction, don’t be shocked if $0.30 comes into view sooner than expected.
TRON (TRX) might not be dominating headlines, but its recent chart behavior says something is brewing beneath the surface. After weeks of tight consolidation, TRX is testing key resistance levels that could trigger the next major move. With on-chain momentum picking up and price hugging crucial moving averages, traders are starting to wonder — is TRON price about to wake up?
Let’s take a closer look at what the charts are revealing right now.
TRON Price Prediction: A Slow Grind Toward the Breakout Zone
TRX/USD Daily Chart- TradingView
On the daily chart, TRX has been moving in an incredibly tight range , floating between $0.235 and $0.248 for most of April. This sideways action, while frustrating for traders, has served a critical purpose: it’s allowed TRON to base itself above the 200-day simple moving average (SMA), now sitting at $0.225. That’s a bullish sign of longer-term strength.
TRON Price is currently testing resistance at $0.248 , just under the 20-day SMA ($0.2417) and 50-day SMA ($0.2357). With the 100-day SMA now sitting at $0.2370 and the moving averages flattening, a crossover may be setting up in TRX’s favor. Momentum appears to be quietly shifting — and the Accumulation/Distribution Line (ADL), sitting at 1,571.71, is starting to recover from its April dip.
Hourly Chart Shows Pressure Building
TRX/USD ! Hr Chart- TradingView
The hourly chart is more energetic. TRX price recently reclaimed its 200-hour SMA and is now printing consistent green candles just under $0.248. A breakout above this level, if paired with volume, could push price toward the $0.255–$0.260 range quickly.
What stands out is how cleanly TRX price has moved above all short-term moving averages (20, 50, 100-hour), with the hourly ADL rising to 1,328.09. This suggests that the recent rally isn’t just retail-driven — there's sustained accumulation from larger hands taking place.
If bulls can push through $0.25 and confirm a breakout, it would break the consolidation pattern that’s capped TRX for nearly a month.
What’s Driving the Quiet Strength?
TRON's lack of hype could actually be its strength. While other altcoins have suffered from speculative boom-bust cycles, TRX has steadily maintained technical support and has continued expanding its ecosystem — especially in the DeFi and stablecoin sectors across Asia.
With market focus shifting back to solid Layer 1s and utility-driven projects, TRON might be positioned for a catch-up rally. The consistent hold above the 200-day SMA supports this narrative, and technicals suggest bulls are slowly but surely regaining control.
TRON Price Prediction: What Happens Next?
If TRON price successfully closes above $0.25 on the daily timeframe, the next resistance levels are $0.265 and $0.278 — both of which acted as key rejection points earlier this year. Breaking above $0.278 would open up space for a run toward $0.30, a level that hasn't been tested since early January.
However, failure to break and hold above $0.25 could send TRX price back to retest its support near $0.237 or even the 200-day SMA at $0.225. The next 48 hours will be crucial for confirming whether this rally has real legs.
Final Thoughts: A Sleeper Altcoin Gearing Up?
TRON isn’t the flashiest coin in the market, but its technical setup looks healthier than most. With price holding above major moving averages, volume gradually increasing, and accumulation picking up again, the foundation for a larger breakout is forming.
While the market watches other trendier tokens, TRX price may be the quiet underdog getting ready to surprise everyone. If it breaks past $0.25 with conviction, don’t be shocked if $0.30 comes into view sooner than expected.
Disclaimer: The content of this article solely reflects the author's opinion and does not represent the platform in any capacity. This article is not intended to serve as a reference for making investment decisions.
You may also like
The “American Mining Dream” of Bitcoin Mining Firms Shattered! Miners Shift to AI Data Center Construction, Scarce Electricity Becomes Key to Valuation Reshaping
Due to the rapid development of artificial intelligence and the crash in cryptocurrencies, Donald Trump's plan to concentrate bitcoin mining activities in the United States is collapsing. Compared to October last year, the computing power consumed by bitcoin mining has decreased by 18%.

The "tax-free dividend" for data centers changes! Over ten US states reassess tax incentives, AI computing power expansion faces new obstacles
For AI computing power investment themes, policy changes primarily affect where to build, at what cost, and when investment returns can be realized. Ohio's data center incentives cover computing equipment, cooling systems, power equipment, and some building materials, so adjustments could impact the entire facility.

86% of S&P 500 Components Beat Earnings Expectations! AI Boom Fuels S&P 500 Profit Growth, Full-Year Growth Forecast Raised to 32%
The full-year profit expectations for the S&P 500 Index are rising, supported by the artificial intelligence boom and stronger-than-expected earnings performance in the first half of the year.

From daily leverage to hourly leverage! The lesson from South Korea is still fresh, Wall Street is once again testing even more extreme retail trading tools
Defiance ETFs has filed documents with the U.S. Securities and Exchange Commission (SEC), planning to launch a series of leveraged funds that aim to double the gains or losses of certain individual stocks—not on a daily basis, but calculated hourly.

Crypto prices
More


