
HYPE price tracks toward $20 as bullish pattern signals major comeback

HYPE is flashing strong bullish signals as it nears a breakout from a falling wedge pattern.
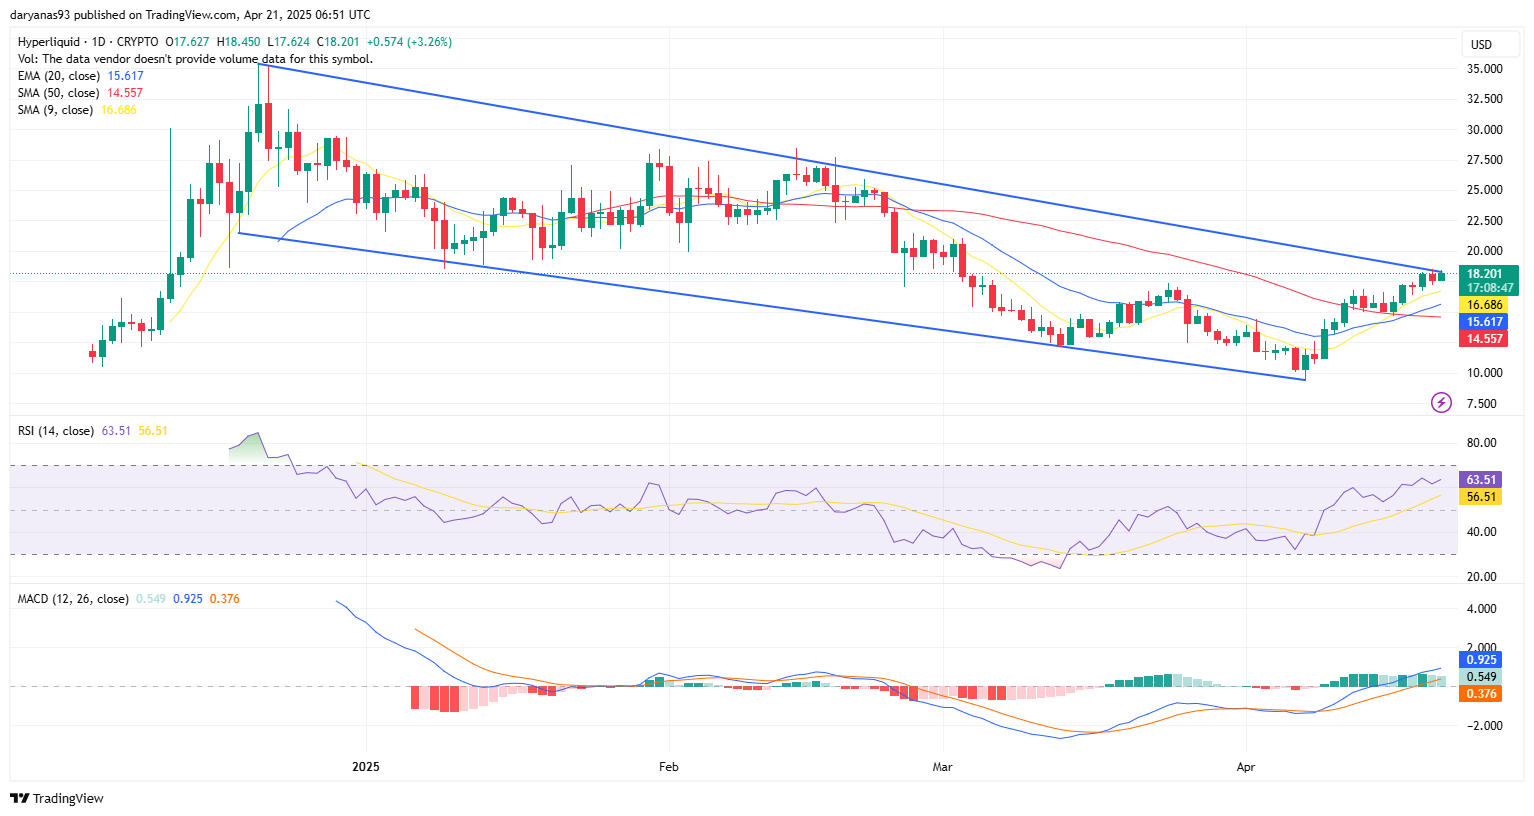
Hyperliquid ( HYPE ) is showing strong bullish momentum as it’s currently on the verge of breaking out of the falling wedge formation and trading above the key moving averages — including 20-day Exponential Moving Average, 9-day Simple Moving Average, and 50-day Simple Moving Average.
After reaching its all-time high of $35.02 on 21 December, HYPE price price entered a downtrend, carving out a falling wedge formation. The price bottomed near $9 on April 7, touching the wedge’s lower trendline before then bouncing and testing the previous resistance at around $17.30. Since then, it has climbed above all major moving averages, including SMA 9, EMA 20 and, SMA 50. The 20 EMA and 50 SMA just had a bullish cross, signaling trend reversal.
The RSI is currently sitting at 63.51, indicating that bullish momentum is picking up. MACD also shows bullish crossover, with both lines above zero.
 Source: TradingView
If HYPE holds above $18, the next major resistance lies at the psychological $20 level, which also aligns with the zone where the price was supported multiple times throughout January and February until it broke lower in early March.
Once $20 is cleared, the next key resistance to watch is around $26 — where the upper trendline meets with the lower high that formed in mid February.
If the wedge breakout is confirmed and the price holds above $18 with increasing volume, a longer-term target of $35 becomes possible — aligning with the origin of the upper trendline of the falling wedge.
The bullish thesis would be invalidated if HYPE fails to hold above the $18 support zone, especially on increasing sell volume. A breakdown back below the 50-day SMA and 20-day EMA would suggest a loss of momentum and could open the door for a retest of the $17.30 level or even a move back toward the wedge’s lower trendline near $12–$13.
Disclaimer: The content of this article solely reflects the author's opinion and does not represent the platform in any capacity. This article is not intended to serve as a reference for making investment decisions.
You may also like
The ultimate bottleneck for AI is not just electricity, but also the electricity bill! As data centers become a focus in the US elections, AI infrastructure investment faces a "ballot stress test"
In 2026, data center spending, as the backbone of the artificial intelligence industry, will reach a record high. However, alongside the boom in infrastructure construction, opposition to data centers has risen sharply this year. What started as a localized issue has quickly evolved into a key topic for the November midterm elections.

Eurozone Bond Yields Rise as Brent Touches $100; 10-Year Bund Yield Hits 15-Year High -- Update
From AI to gold and U.S. Treasury bonds: almost everything is surging to new highs, the market welcomes “Everything High”
AI capital expenditure and corporate earnings expectations continue to rise, while energy, gold, US Treasury yields, and market positions are also climbing. On the surface, this suggests a comprehensive increase in growth and risk appetite; however, when inflation, interest rates, and crowded trades are all at high levels, the market's tolerance for the sustainability of the AI boom is also narrowing.
Trump pushes Fed to cut rates, but Waller may go the opposite way: Next week’s meeting faces a “three-way choice”
Bloomberg columnist Claudia Sahm believes that as Trump continues to pressure for rate cuts while inflation remains well above the 2% target, raising rates is becoming an option again, leaving Waller facing a tough decision next week. The Federal Reserve has three paths: raising rates without Waller’s support, which could trigger rare internal divisions; holding steady, which may invite criticism of political interference; or Waller leading a rate hike, which could withstand White House pressure and defend policy independence.
Crypto prices
More


