
Hedera (HBAR) Trading Volume Drops 27% Despite Signs of Bullish Recovery

HBAR is at a technical turning point with climbing RSI and bullish EMA structure, but weak trend strength and falling volume raise caution.
Hedera (HBAR) is showing mixed signals as it hovers at a key technical juncture. Its market cap is currently at $7 billion. Despite signs of growing momentum, trading volume has dropped 27% in the last 24 hours, now sitting at $104.29 million.
While indicators like the RSI and EMA lines hint at a potential bullish breakout, the BBTrend remains negative, suggesting that trend strength is still fragile. For now, HBAR’s price movement reflects a market in transition, caught between fading volatility and early signs of renewed interest.
HBAR Trend Weakness Eases, But Momentum Still Lacking
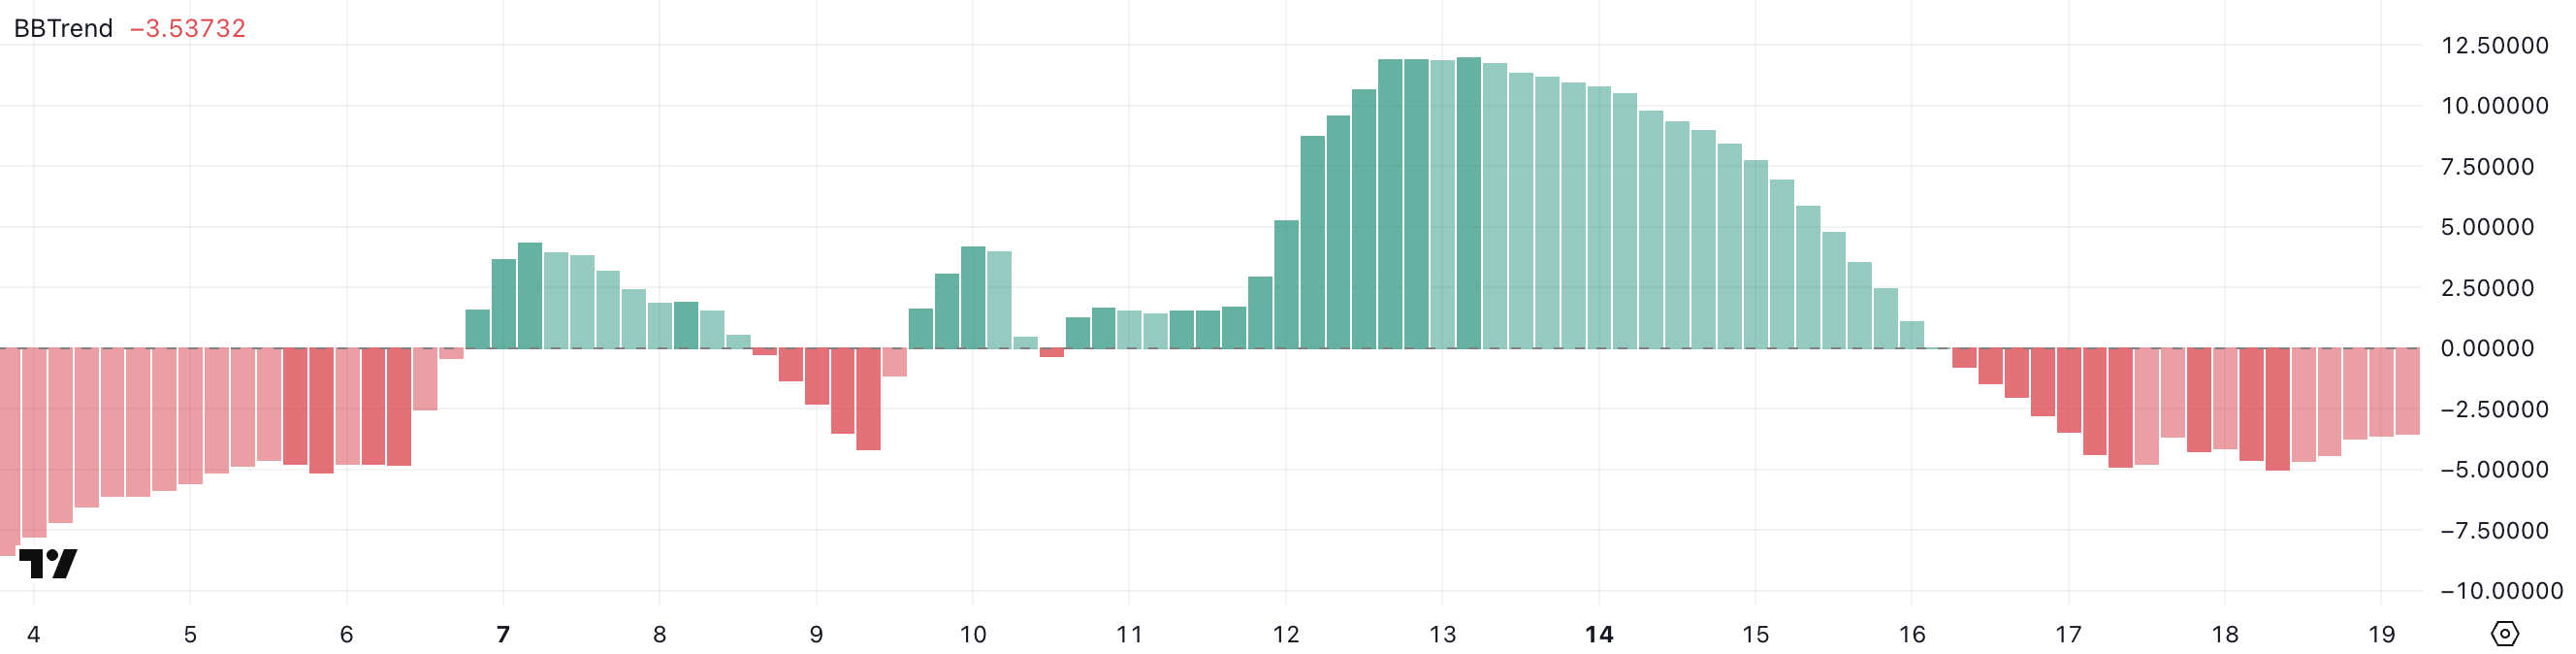
Hedera’s BBTrend indicator is currently at -3.53 and has remained in negative territory for nearly three consecutive days. Just yesterday, it hit a recent low of -5, signaling particularly weak trend strength during that period.
Although it has slightly recovered, the fact that BBTrend remains below zero indicates that momentum is still lacking, and the price action is showing limited direction or energy.
This prolonged dip suggests that HBAR may be stuck in a period of consolidation or at risk of entering a broader downtrend if no bullish momentum emerges.
 HBAR BBTrend. Source:
TradingView
HBAR BBTrend. Source:
TradingView
BBTrend, or Bollinger Band Trend, measures the strength and volatility of a price trend by analyzing the expansion or contraction of Bollinger Bands.
Positive values typically suggest strong directional movement, while negative values point to weakening trends and reduced volatility. With BBTrend still sitting at -3.53, HBAR remains in a low-energy zone where neither buyers nor sellers are taking clear control.
Unless the indicator returns to positive territory, HBAR may continue to drift sideways or gradually decline, reflecting market indecision and a lack of strong conviction.
HBAR Builds Momentum as RSI Climbs
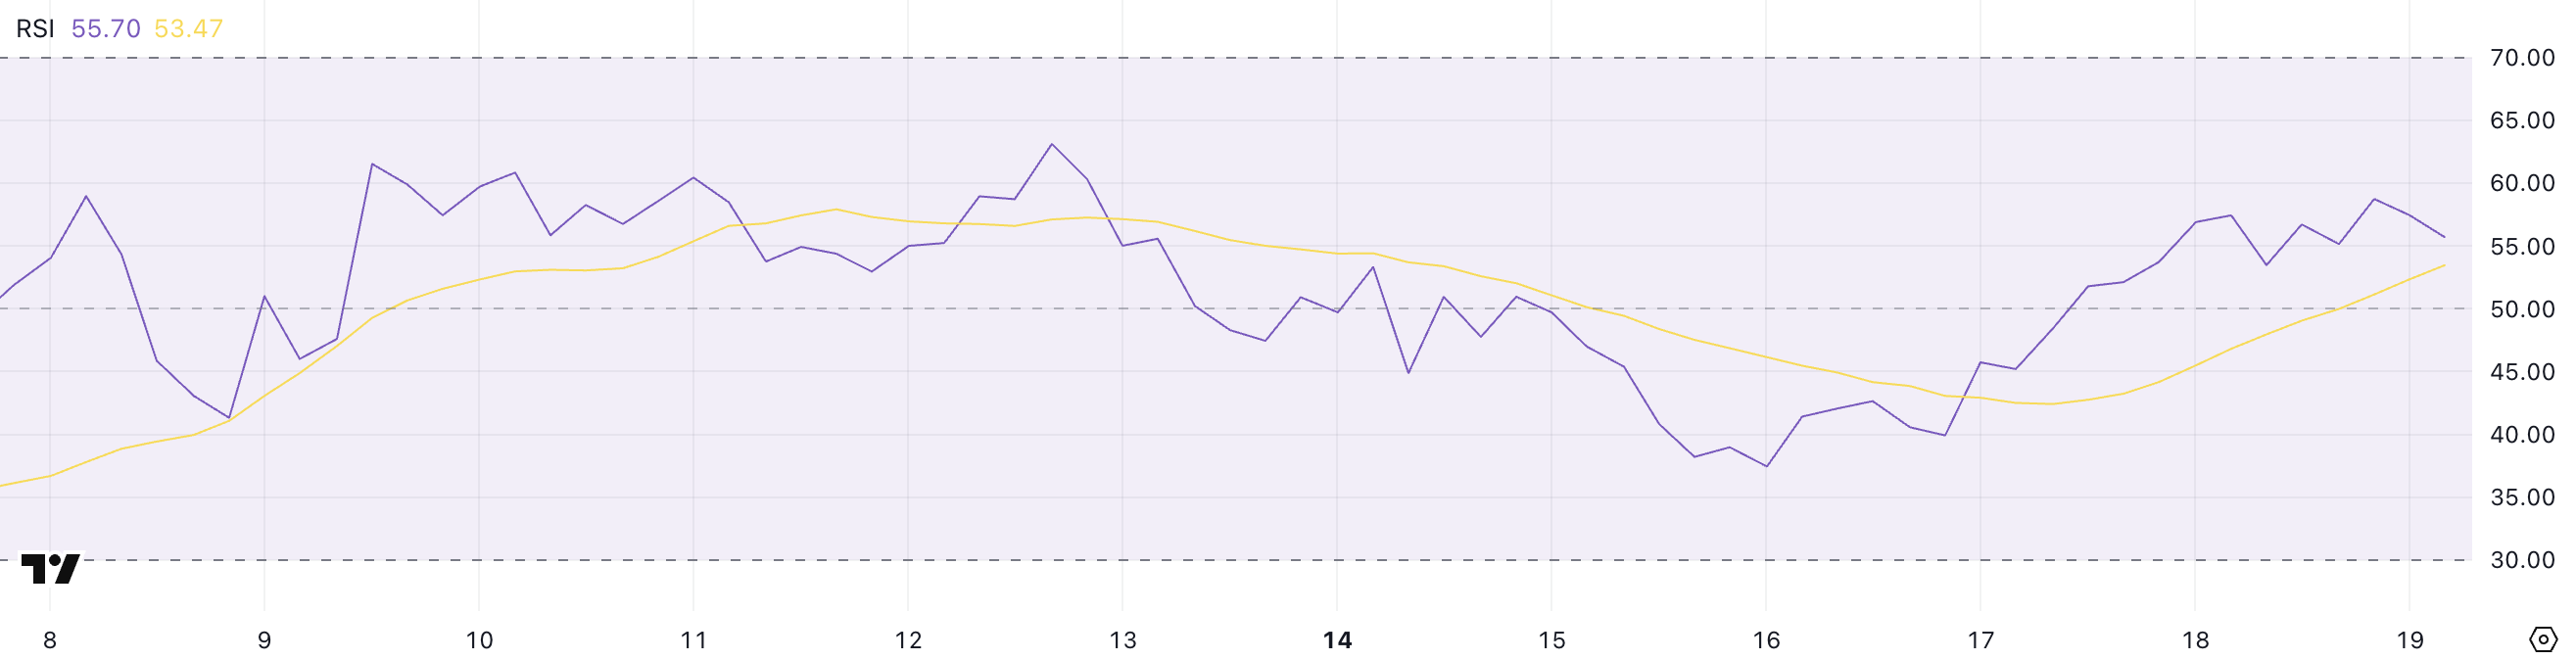
Hedera’s RSI (Relative Strength Index) is currently at 55.70, rising from 45 just two days ago. This upward move reflects increasing bullish momentum, showing that buying pressure has picked up after a short period of weakness.
While the RSI remains below overbought levels, the steady rise suggests growing interest in HBAR and a potential continuation of its current upward push, provided that momentum sustains.
For now, the price appears to be gaining strength without yet signaling overextension.
 HBAR RSI. Source:
TradingView
HBAR RSI. Source:
TradingView
The RSI is a momentum oscillator that measures the speed and magnitude of recent price changes, typically on a scale from 0 to 100. Readings above 70 are generally considered overbought, while those below 30 are viewed as oversold.
With HBAR’s RSI now at 55.70, it sits comfortably in neutral-bullish territory, indicating room for further upside before reaching overheated conditions.
If this trend continues and RSI edges closer to 70, it could support a short-term rally—but also raise caution for potential exhaustion ahead.
Hedera Set for Bullish Crossover, But Risks Remain Below $0.153
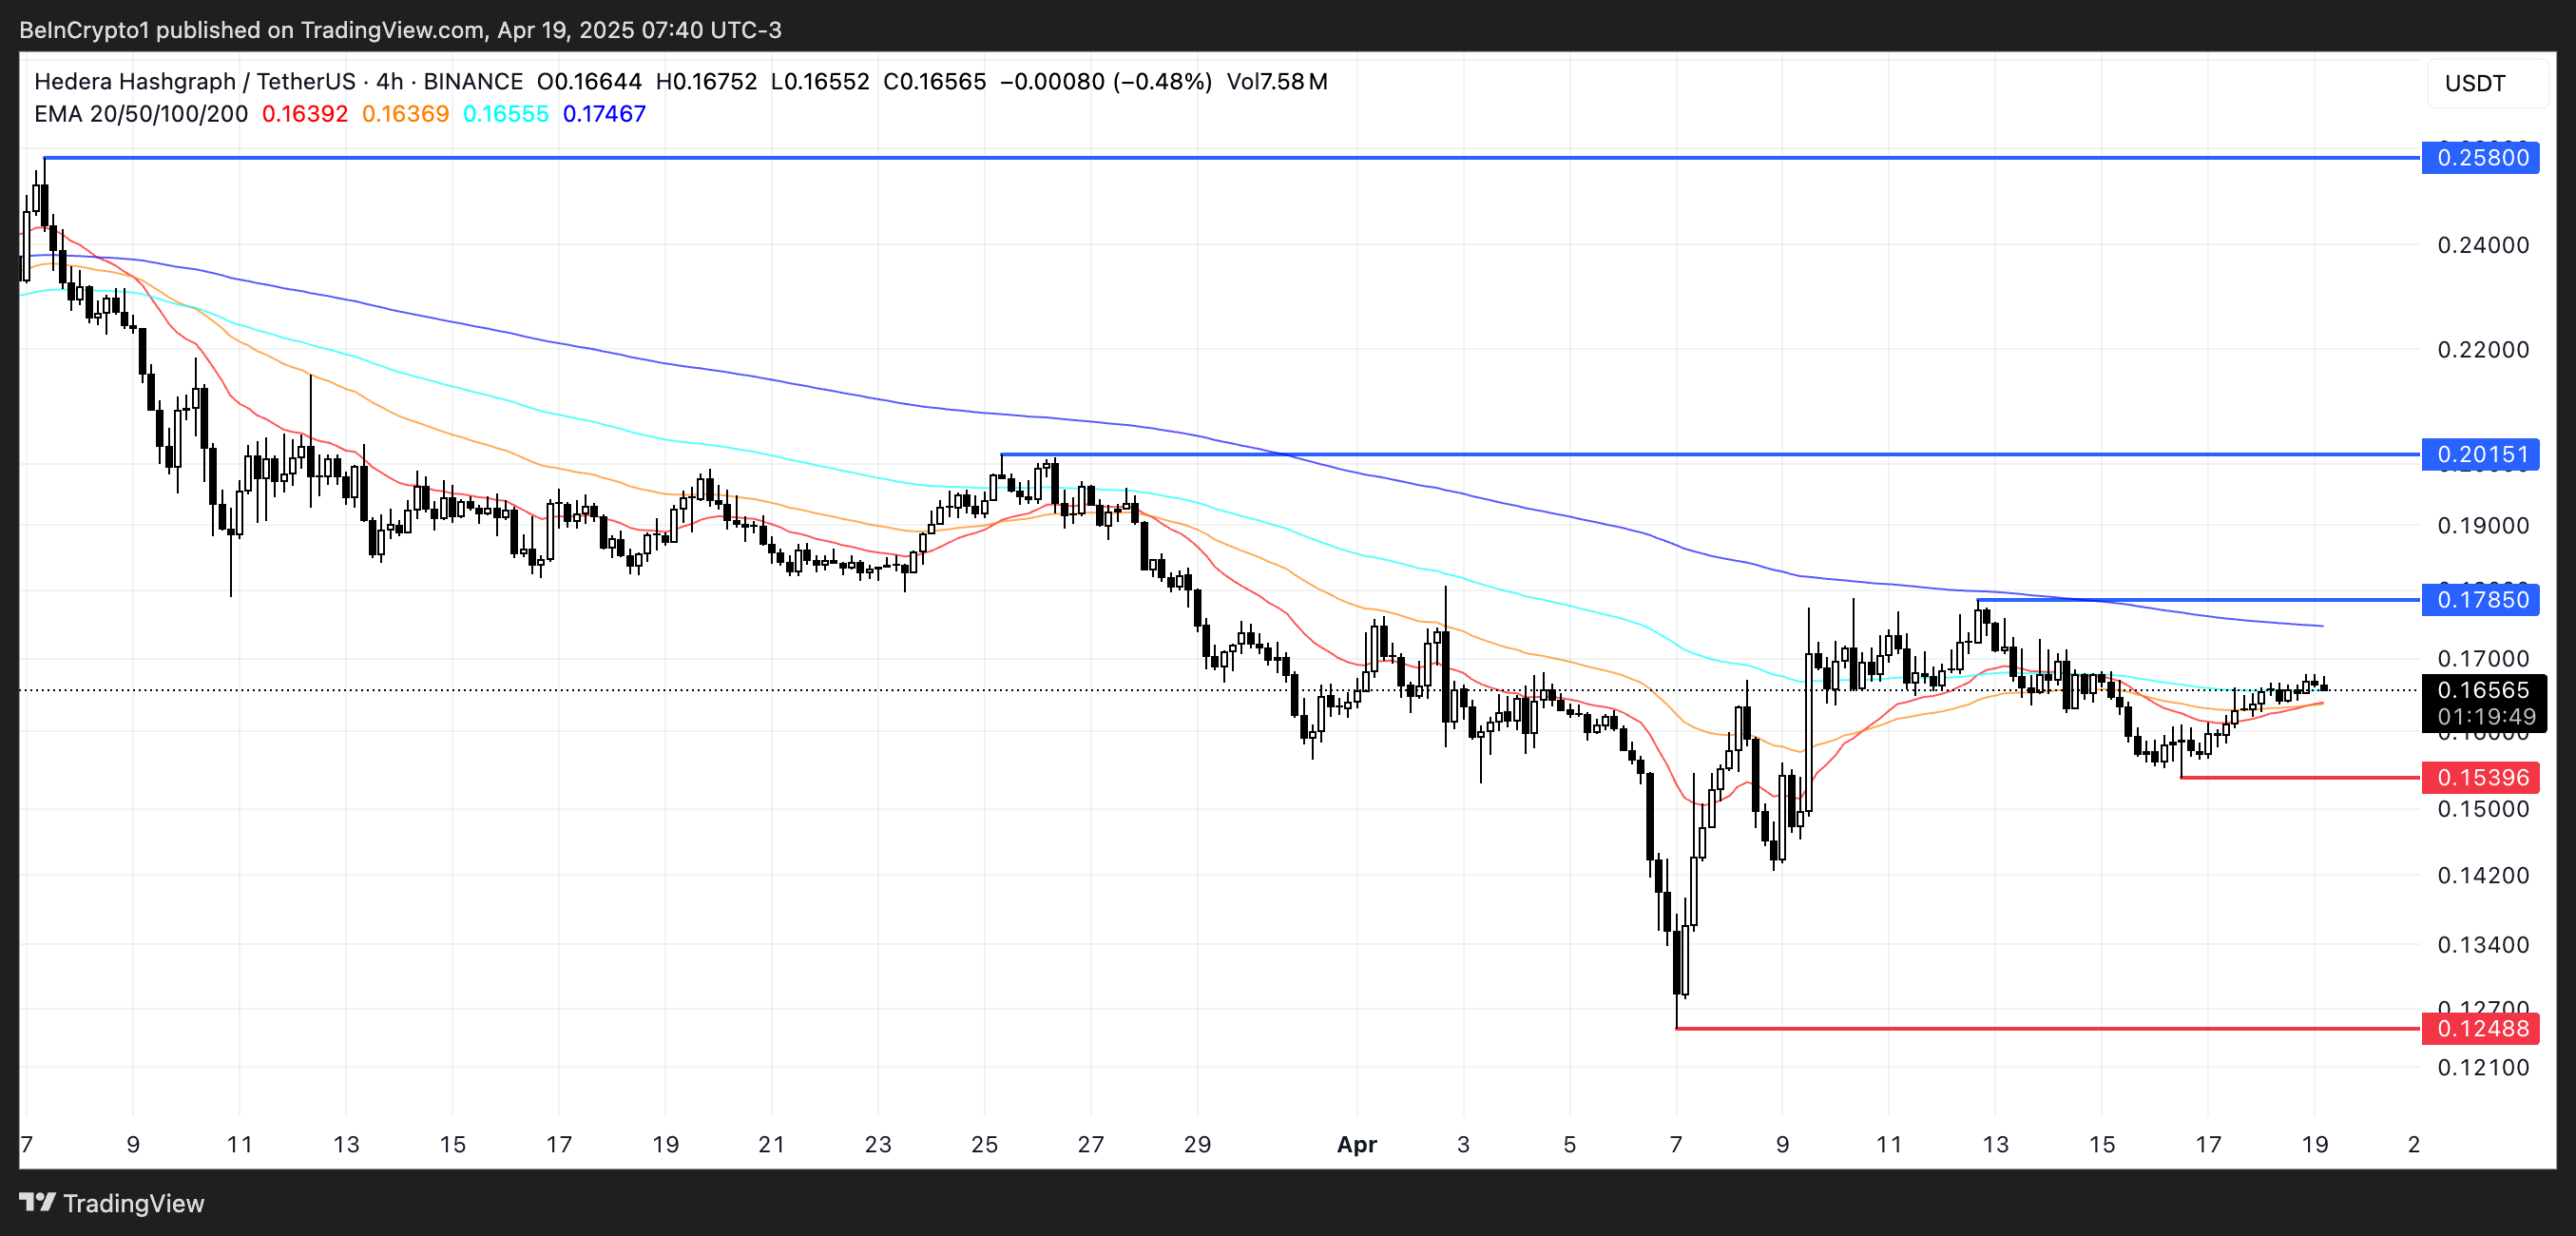
Hedera’s EMA lines are currently showing signs of a potential golden cross forming, which could signal a shift toward a bullish trend. If this crossover happens and momentum strengthens, Hedera’s price may test the resistance at $0.178.
A breakout above that level could pave the way for a move toward $0.20. If the rally accelerates, prices could climb to $0.258, marking the first time HBAR trades above $0.25 since early March.
 HBAR Price Analysis. Source:
TradingView
HBAR Price Analysis. Source:
TradingView
The upward slope in short-term EMAs reflects growing optimism, but confirmation will depend on volume and price action in the coming sessions.
However, downside risks still remain. If HBAR fails to hold the support level at $0.153, bearish pressure could drag the token down to $0.124.
While technicals are currently leaning bullish, the price remains at a crucial crossroads, with both breakout and breakdown scenarios in play. Until a clear direction emerges, traders should watch these key levels closely.
Disclaimer: The content of this article solely reflects the author's opinion and does not represent the platform in any capacity. This article is not intended to serve as a reference for making investment decisions.
You may also like
Eurozone Bond Yields Rise as Brent Touches $100; 10-Year Bund Yield Hits 15-Year High -- Update
From AI to gold and U.S. Treasury bonds: almost everything is surging to new highs, the market welcomes “Everything High”
AI capital expenditure and corporate earnings expectations continue to rise, while energy, gold, US Treasury yields, and market positions are also climbing. On the surface, this suggests a comprehensive increase in growth and risk appetite; however, when inflation, interest rates, and crowded trades are all at high levels, the market's tolerance for the sustainability of the AI boom is also narrowing.
Trump pushes Fed to cut rates, but Waller may go the opposite way: Next week’s meeting faces a “three-way choice”
Bloomberg columnist Claudia Sahm believes that as Trump continues to pressure for rate cuts while inflation remains well above the 2% target, raising rates is becoming an option again, leaving Waller facing a tough decision next week. The Federal Reserve has three paths: raising rates without Waller’s support, which could trigger rare internal divisions; holding steady, which may invite criticism of political interference; or Waller leading a rate hike, which could withstand White House pressure and defend policy independence.
Onyxcoin [XCN] rallies 20% after neobank vote – What comes next?
![Onyxcoin [XCN] rallies 20% after neobank vote – What comes next?](https://img.bgstatic.com/spider-data/2dbc6ea1d6782dbe45a2fac096007f111788948393658.png?w=420&h=236&f=webp)
Crypto prices
More


