
Bitcoin Stalls: Is a Market Correction Looming? In-Depth Technical Analysis for February 11, 2025

After falling to $91,350, Bitcoin has sparked interest from buyers, maintaining its price. Discover Elyfe’s analysis to decode the technical outlook of BTC.

Bitcoin (BTC) Price Situation
After diving towards the support of $91,350, the price of Bitcoin benefited from buyer interest, allowing it to rebound and re-enter the $100,000 zone. Unfortunately, the cryptocurrency failed to break this threshold. Nevertheless, BTC has managed to hold above $95,000, demonstrating a strong buyer support.
At the time of writing, Bitcoin is trading around $98,200. It is located under a significant value zone, encompassing its annual VWAP, situated at the same level as its monthly pivot point at $100,335. Although the short-term trend remains bearish, medium and long-term trends remain bullish. This observation is illustrated by the positioning of the 50 and 200-day moving averages, which are crossed and oriented upwards.
On the bullish momentum side of Bitcoin, it has been revised downwards but now seems to be stabilizing, allowing for the possibility of an upcoming rebound. This is reflected in both its price and its oscillators.
 BTCUSD Daily Chart
The current technical analysis has been conducted in collaboration with Elyfe , a cryptocurrency market investor and educator.
Focus on Derivatives (BTC/USDT)
The open interest and funding rate of the BTC/USDT perpetual contracts have recently been revised upwards, accompanying the appreciation of their underlying price. This reflects a strong buyer interest, influencing the direction of Bitcoin.
The CVD analysis shows that it remains in a bearish trend, although it displays signs of stabilization. This suggests a predominance of sell orders, but with pressure gradually tending to ease.
Liquidations have remained limited on both sides of the market since the last Bitcoin correction, with no significant movement for either buyers or sellers. This situation reflects a stable market, controlled volatility, and cautious risk management, indicating a certain balance. However, this state of stability cannot last indefinitely and deserves particular attention, as a rebound in volatility could occur soon.
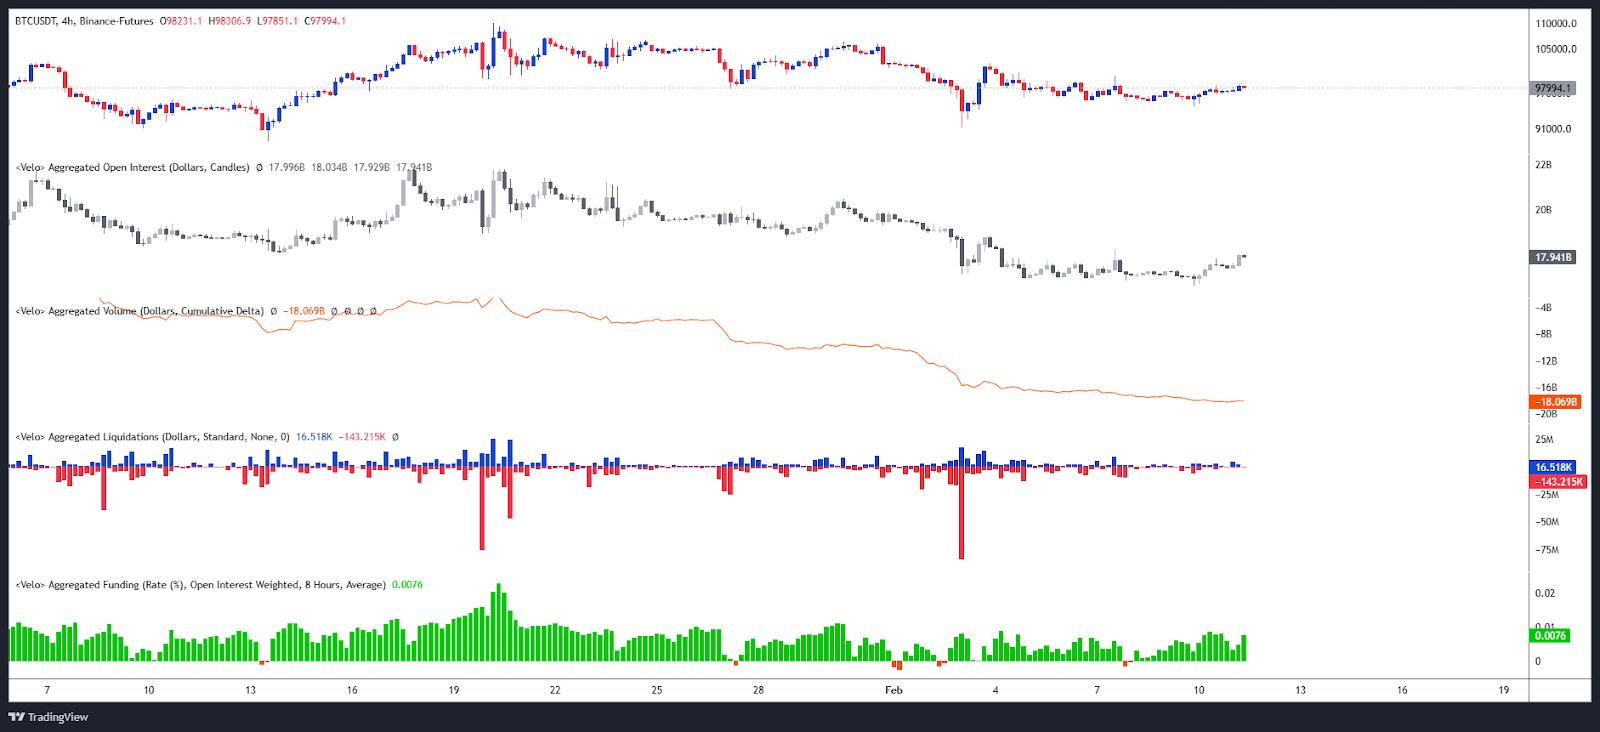 Bitcoin Open Interest / Liquidations / CVD & Funding rate
The liquidation heatmap of BTC/USDT perpetual contracts shows that Bitcoin reached a significant liquidation zone below $96,000, before seeing its price rebound. This price level has thus attracted notable buyer interest.
Currently, the most significant liquidation zones above the current BTC price are located between $100,000 and $104,000. Higher up, an even more marked zone appears between $106,500 and $111,000. In contrast, below the current price, the most important liquidation zones are first found below $95,000, with a more subtle area around $90,000. However, the most notable is around $88,000.
If the price approaches these levels, it could trigger a large number of orders, thus increasing the risk of volatility for the cryptocurrency. Therefore, these zones represent crucial points of interest for investors.
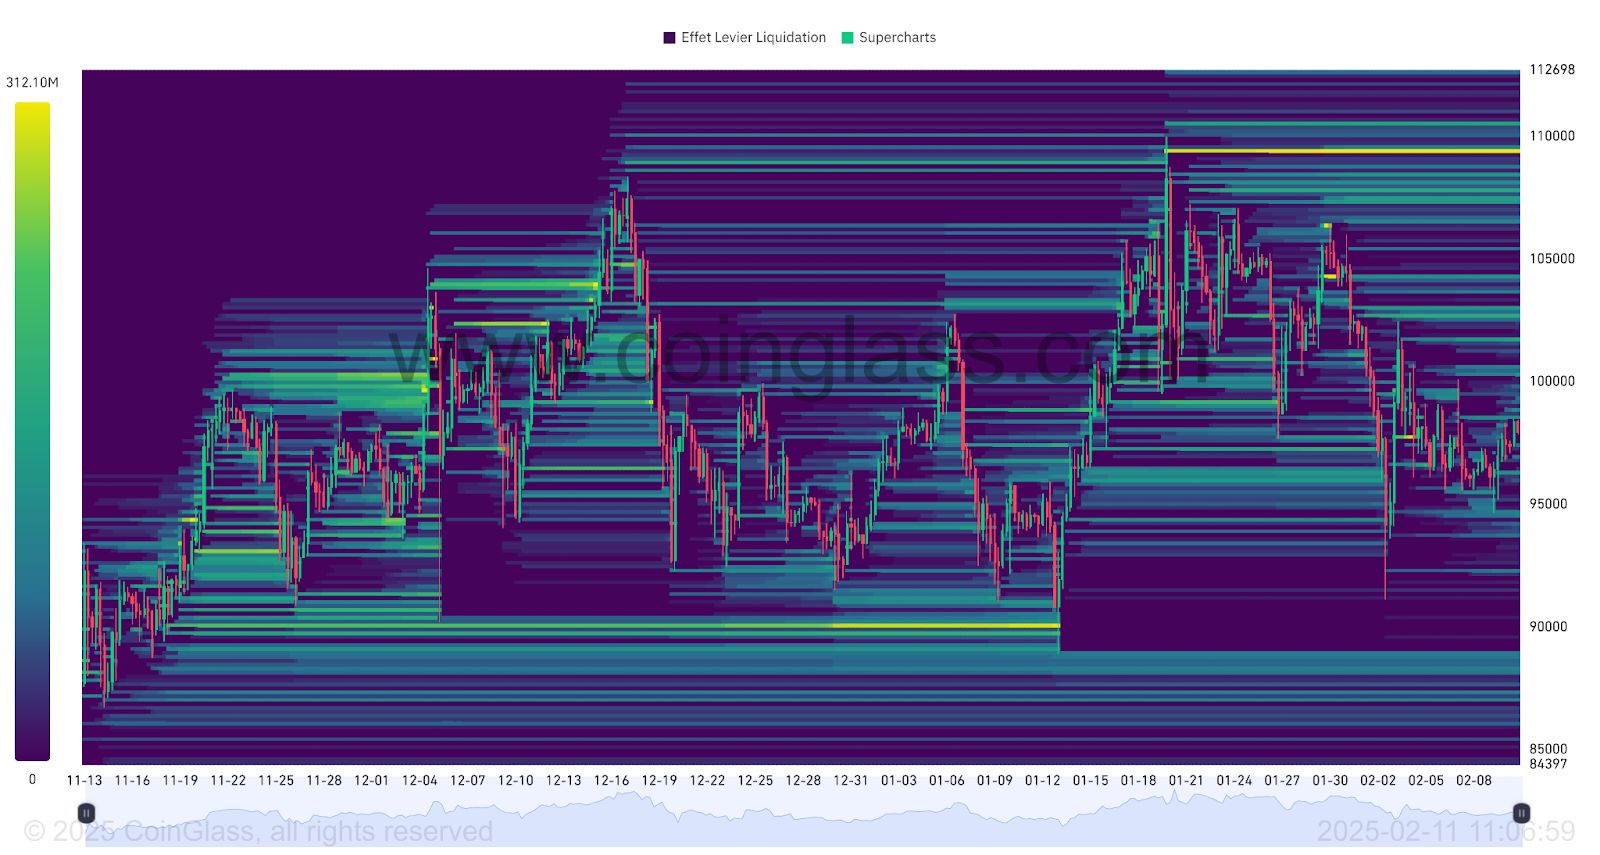 BTC Liquidation Heatmap
Forecasts for Bitcoin (BTC) Price
- If Bitcoin can maintain above $94,000, a recovery could allow it to break past $100,335, thus paving the way towards $102,500. Breaking this threshold could then favor a return towards $106,000, and then towards its ATH of $109,354, representing an increase of around 12%.
- Conversely, if Bitcoin fails to hold above $94,000, it may find support around $92,200. A prolonged decline would then bring its price back towards the support of $90,000. Finally, breaking this level could lead to a further drop towards the $88,000 — $89,000 zone, or even down to $85,000, representing a decrease of approximately 13%.
Conclusion
Despite a correction phase, Bitcoin shows signs of stabilization and retains rebound potential. Buyers remain present, indicating a possible bullish recovery in upcoming movements. In this context, it will be essential to closely monitor price reactions at strategic levels to confirm or adjust current forecasts. Finally, let’s remember that these analyses are based solely on technical criteria, and the price of cryptocurrencies can evolve rapidly based on other more fundamental factors.
Did you find this study interesting? Check out our latest analysis from February 6 .
Disclaimer: The content of this article solely reflects the author's opinion and does not represent the platform in any capacity. This article is not intended to serve as a reference for making investment decisions.
You may also like
Is the "butterfly effect" about to play out in the forex market? 41% hedging sets the stage for an accelerated USD depreciation, with $230 billion in sell orders ready to be unleashed
Some of the largest holders of U.S. assets have minimal protection against a weakening dollar, leaving the dollar at risk of a sharper decline if market sentiment suddenly shifts. As of June 30, these institutional investors in various markets, including Japan and Canada, have hedged only 41% of their foreign exchange risk exposure—this is the lowest level since at least 2015.

Bank of America: August Nonfarm Payrolls Are Just a Warm-up, CPI Is the Real Threshold for September Rate Hike
Bank of America expects only 40,000 new non-farm jobs in August, but even if the data is weak, the impact on rate hike expectations will be limited—because in Federal Reserve Chairman Waller's speech at Jackson Hole, inflation-related terms appeared twice as often as employment-related ones, indicating that inflation is the core policy anchor. Currently, the probability of a rate hike in September is about 70%, but a final conclusion will depend on next week's CPI data.
Wall Street’s 24/7 Trading Plan Could Change Crypto Forever: 5 Altcoins Worth Watching Now

Broadcom’s AI chip revenue jumps 221% as Hock Tan guides higher
Crypto prices
More


