
XRP Has Most Bullish-Looking Chart in Entire Crypto Space, According to Analyst – Here’s Why

A widely followed cryptocurrency analyst and trader is leaning bullish on XRP .
The analyst pseudonymously known as CredibleCrypto tells his 450,200 followers on the social media platform X that paired against Bitcoin ( BTC ), XRP “looks absolutely fantastic.”
The trader says he plans to enter a long position in the coming days.
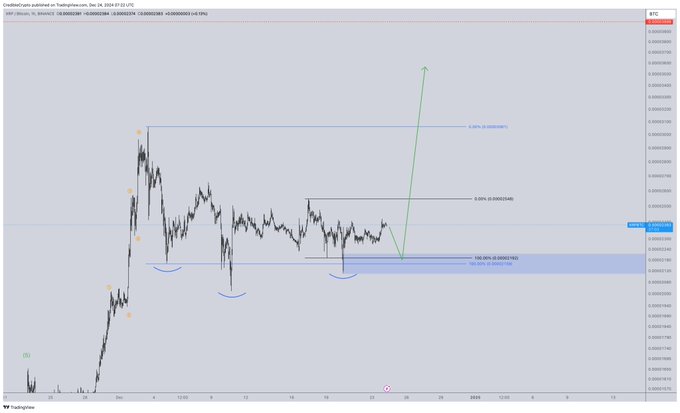
Based on the analyst’s chart on the one-hour time frame, it appears he is suggesting that XRP could first trend downwards before skyrocketing by at least 65%.
It also appears that the analyst believes XRP has formed an inverse head-and-shoulders pattern in the same time frame. An inverse head-and-shoulders pattern is considered a bullish signal in technical analysis.
“Still the most bullish-looking chart in the entire space off the lows in my opinion. Just a powder keg building pressure…”
 Source: CredibleCrypto/X
XRP is trading at 0.00002323 BTC ($2.28) at time of writing.
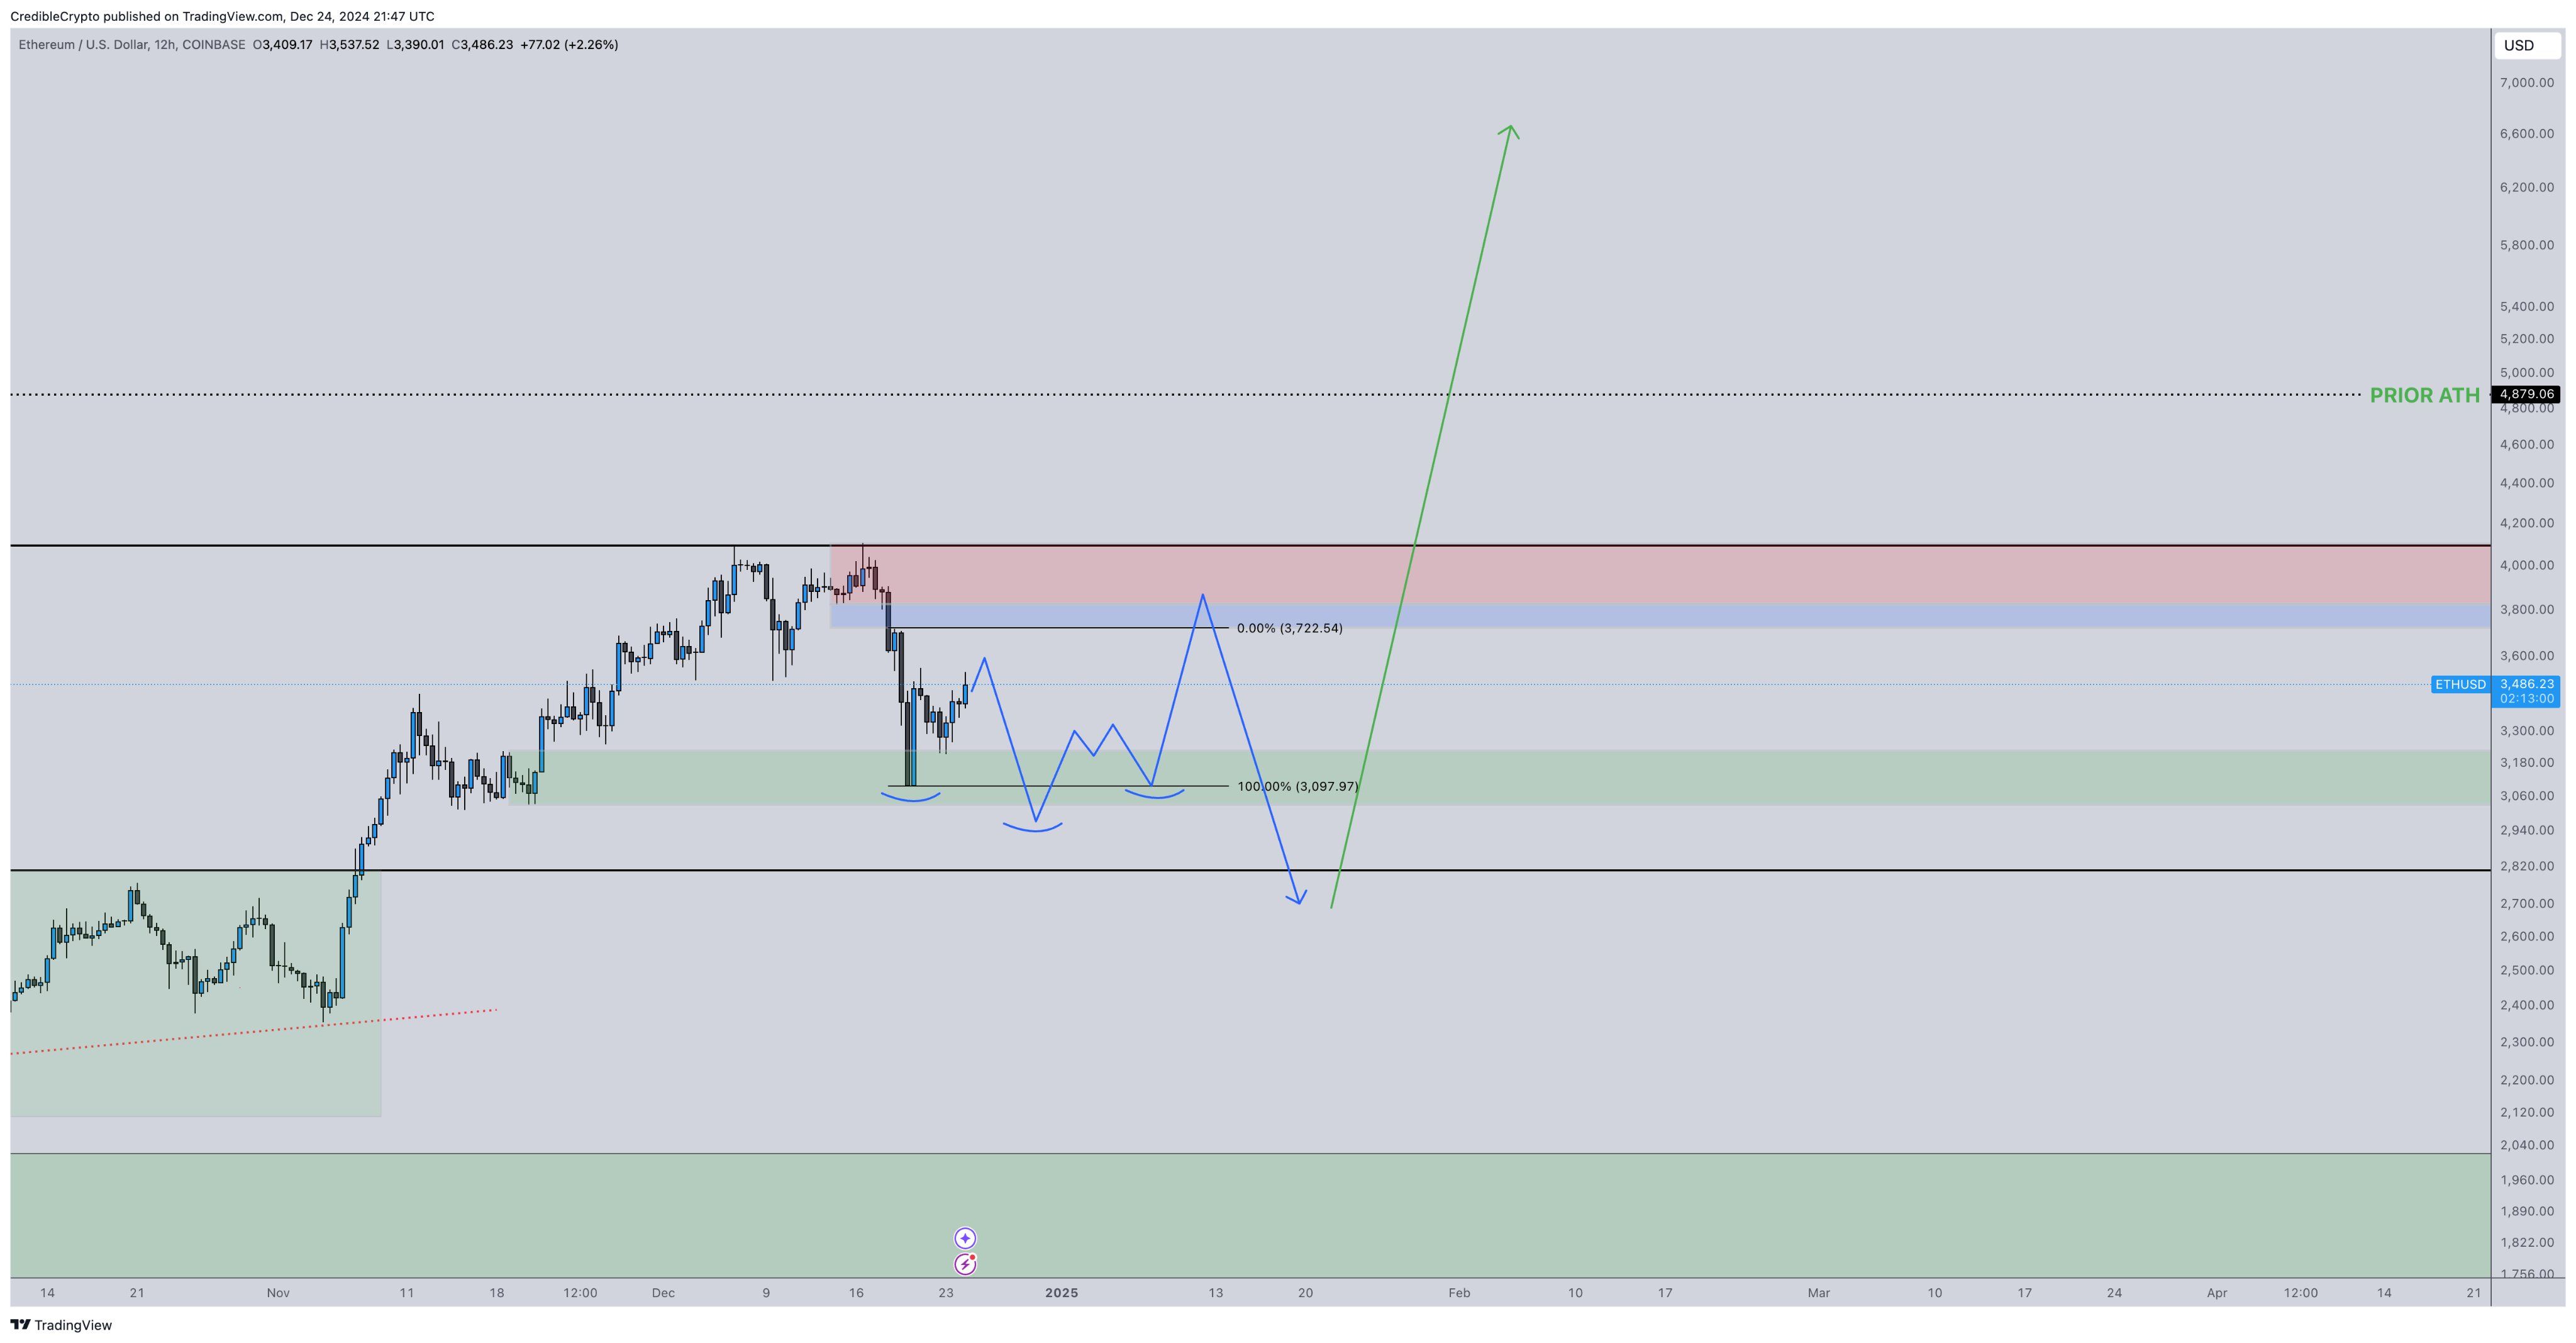
Next up is Ethereum ( ETH ). CredibleCrypto says that ETH is likely to trade in a range of between $3,000 and $3,800 before bottoming out at around $2,800.
Based on the pseudonymous analyst’s chart on the 12-hour time frame, he suggests Ethereum could then rally to a new all-time high above $6,000.
 Source: CredibleCrypto/X
Ethereum is trading at $3,492 at time of writing.
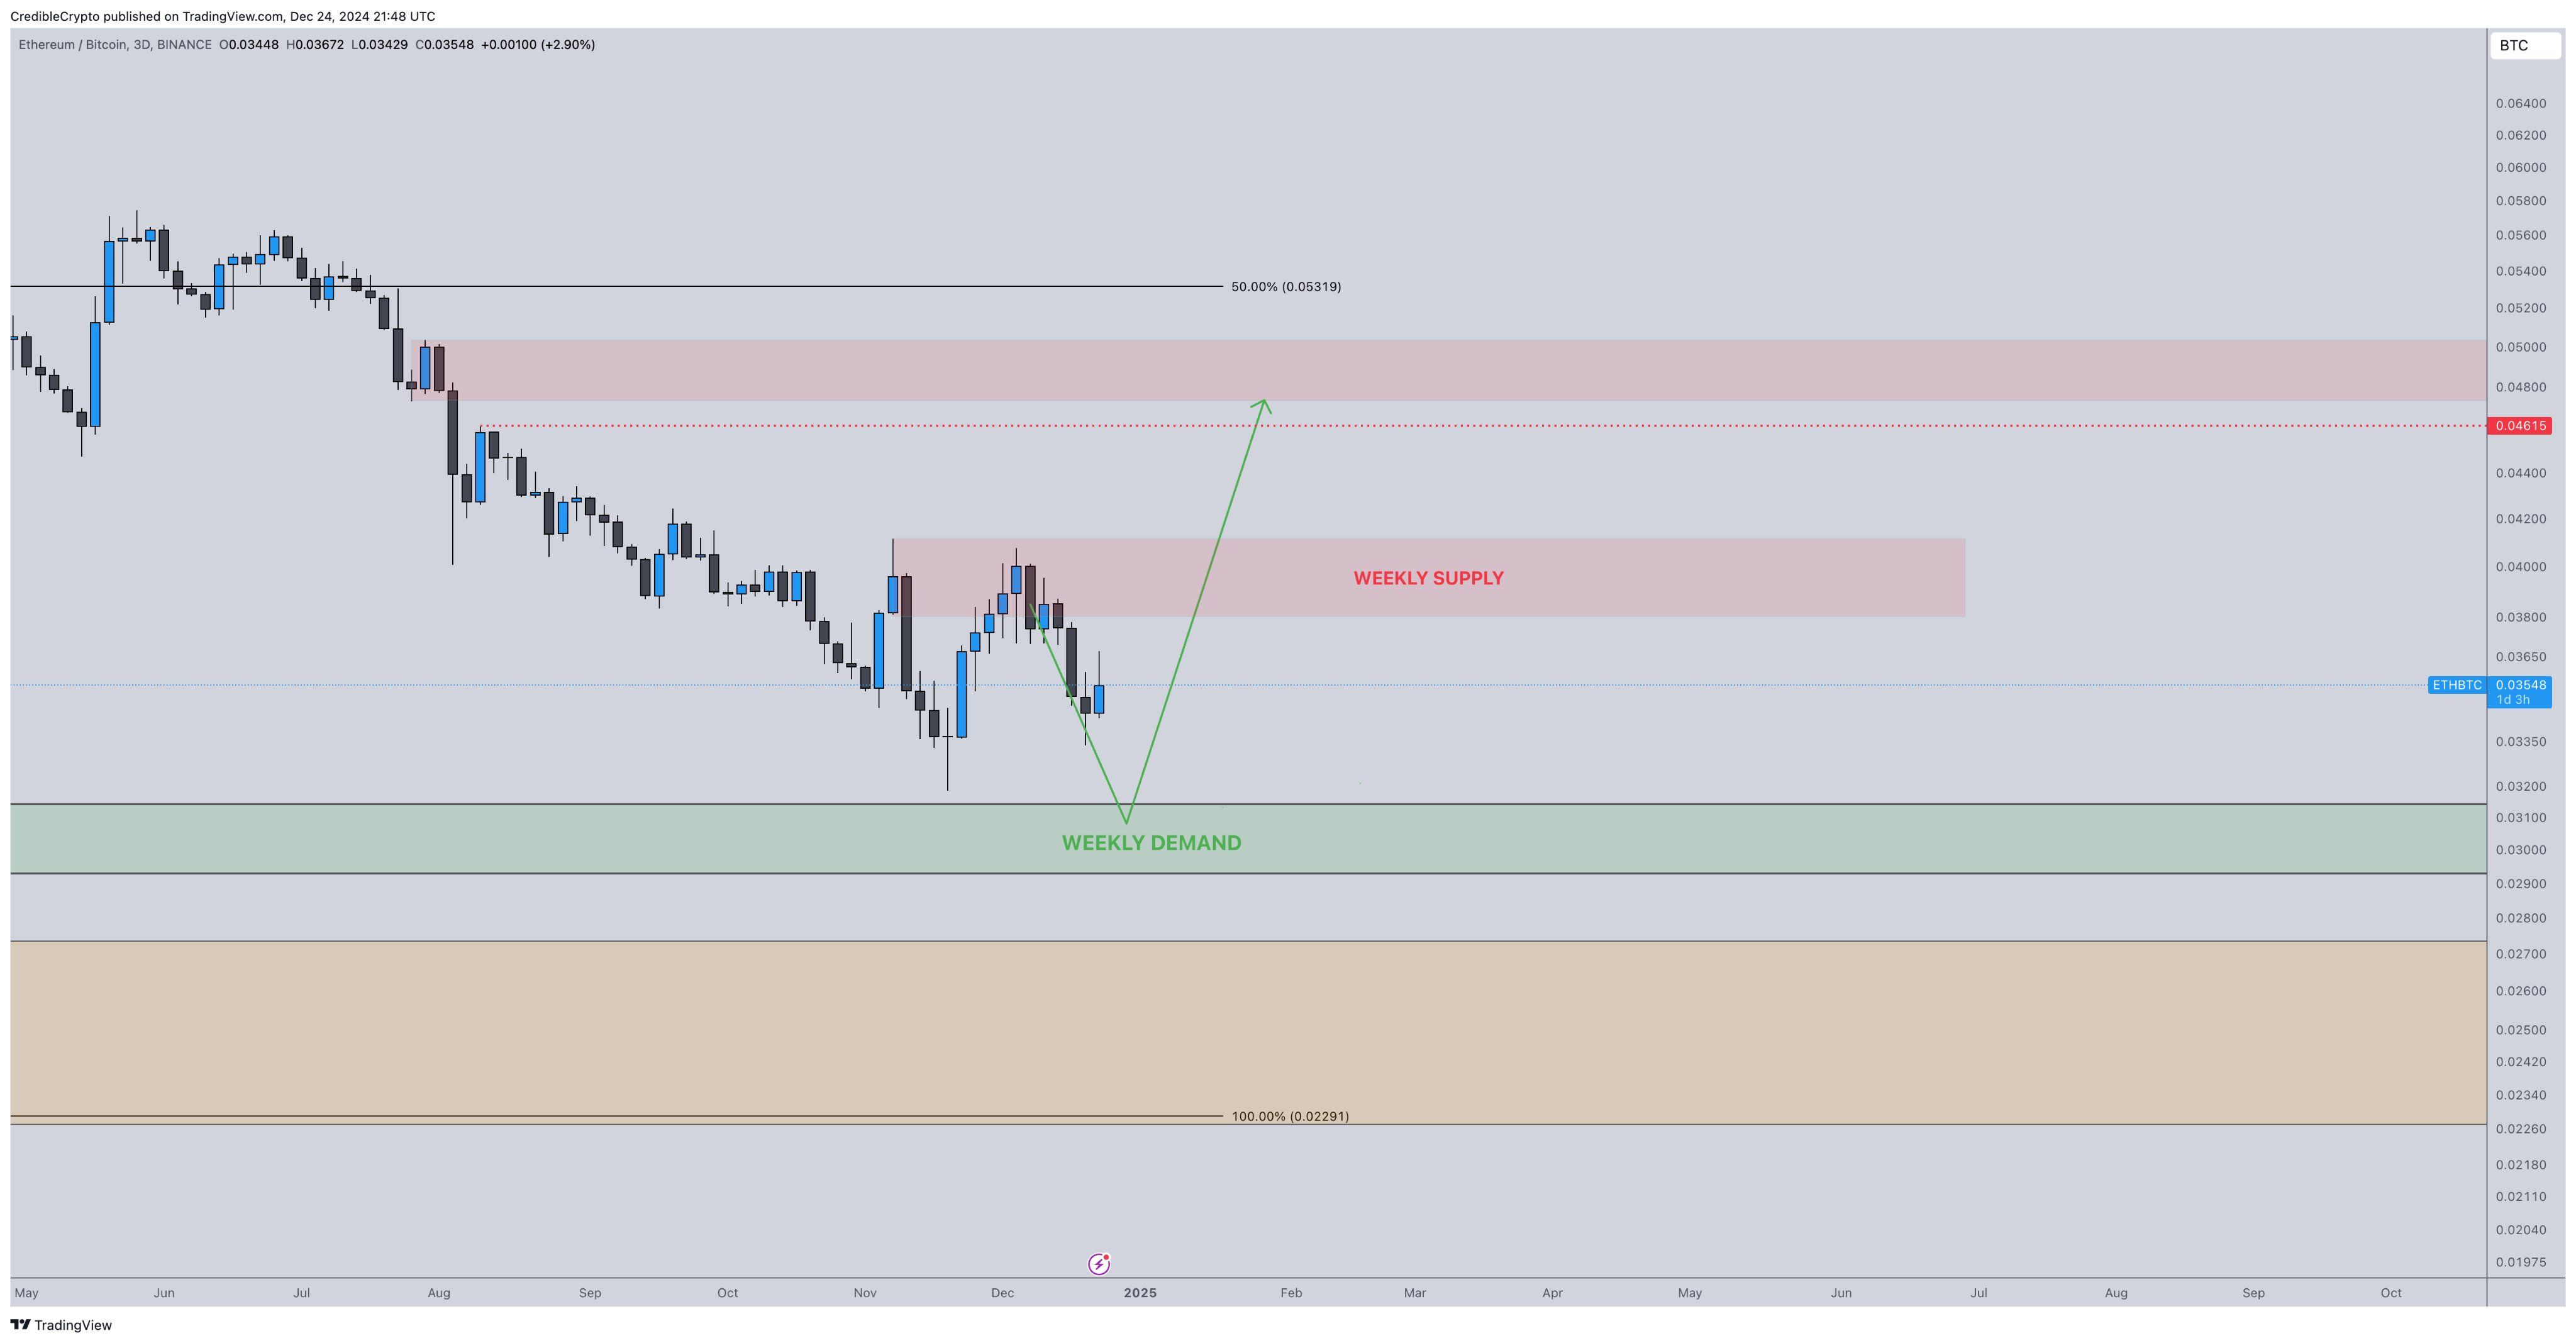
Turning to the Ethereum/Bitcoin pair, the widely followed analyst says he is still targeting Ethereum to drop to around the 0.02700 BTC to 0.02800 BTC level before he can enter a long position. According to CredibleCrypto, ETH/BTC is now “grinding back down” after initially rallying.
“Would be an absolutely epic entry if we get it that will probably mark this cycles pico bottom on ETH/BTC as well.”
 Source: CredibleCrypto/X
ETH is trading at 0.03542 BTC at time of writing.
Don't Miss a Beat – Subscribe to get email alerts delivered directly to your inboxCheck Price Action
Follow us on X , Facebook and Telegram
Surf The Daily Hodl Mix
Featured Image: Shutterstock/Zaleman/INelson
Disclaimer: The content of this article solely reflects the author's opinion and does not represent the platform in any capacity. This article is not intended to serve as a reference for making investment decisions.
You may also like
Following Samsung, will TSMC raise prices by 10-15% across all process nodes?
The surge in AI demand has led to a severe shortage of advanced production capacity at TSMC, with N2 and N3 nodes almost fully booked by Apple and NVIDIA. Following Samsung's move in July to raise 4nm and 5nm process prices by 10–15%, TSMC plans to follow suit, with N3 already increasing by 15%. Prices for N2 and N5 will rise another 5–10% by early 2027 at the latest, and mature nodes such as N12, N16, and N28 will also see hikes of up to 10%. Strong pricing power has prompted Wall Street to significantly raise its earnings forecasts and target prices for the company.
Jackson Hole shows fissures: The U.S. sells euros and buys yen without prior notice; the European Central Bank fears USD swap lines could "disappear overnight"
This incident reveals that the norms of transatlantic financial cooperation are on the brink of collapse. The United States' unconventional unilateral financial actions have triggered deep anxiety in Europe: the political intervention by the Trump administration is disregarding the interests of its allies and could even weaponize the very foundation of global financial stability. Despite the Federal Reserve’s efforts to reassure, it can no longer guarantee against the unpredictability of the U.S. executive branch, severely damaging mutual trust between Europe and America.
Following Samsung, will TSMC raise prices for all processes by 10~15%?
Crypto prices
More


