
Ethereum Price Stuck Near $3K, Indicators Show Risk of Downside Break
Ethereum price is still facing many hurdles near $3,200. ETH could start another major decline if the price stays below $3,200 and $3,280.
- Ethereum is struggling to recover above the $3,200 resistance zone.
- The price is trading below $3,200 and the 100-hourly Simple Moving Average.
- There is a key bearish trend line forming with resistance at $3,120 on the hourly chart of ETH/USD (data feed via Kraken).
- The pair could start another decline if there is a close below the $2,900 support zone.
Ethereum Price Consolidates
Ethereum price found support and attempted a recovery wave above the $3,000 resistance zone. ETH was able to climb above the $3,200 level. However, the bears were active near the $3,280 resistance zone.
A high was formed at $3,278 and the price reacted to the downside, like Bitcoin . It dipped below the 23.6% Fib retracement level of the upward move from the $2,536 swing low to the $3,278 high. Ethereum is now trading below $3,200 and the 100-hourly Simple Moving Average.
Immediate resistance is near the $3,100 level. There is also a key bearish trend line forming with resistance at $3,120 on the hourly chart of ETH/USD. The first major resistance is near the $3,200 level and the 100-hourly Simple Moving Average.
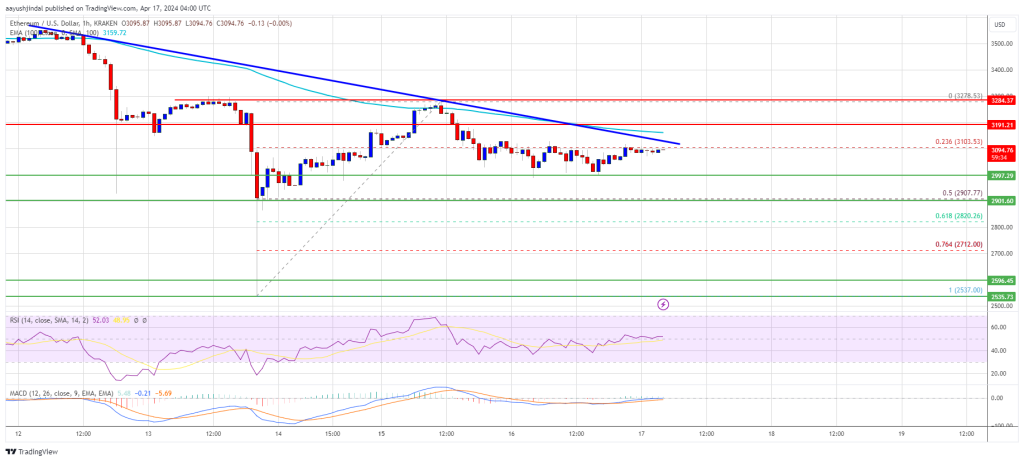
Source: ETHUSD on TradingView.com
The next key resistance sits at $3,280, above which the price might rise toward the $3,350 level. The key hurdle could be $3,500, above which Ether could gain bullish momentum. In the stated case, the price could rise toward the $3,620 zone. If there is a move above the $3,620 resistance, Ethereum could even climb toward the $3,750 resistance.
Another Decline In ETH?
If Ethereum fails to clear the $3,200 resistance, it could start another decline. Initial support on the downside is near the $3,000 level.
The first major support is near the $2,900 zone or the 50% Fib retracement level of the upward move from the $2,536 swing low to the $3,278 high. The next key support could be the $2,710 zone. A clear move below the $2,710 support might send the price toward $2,650. Any more losses might send the price toward the $2,550 level.
Technical Indicators
Hourly MACD – The MACD for ETH/USD is losing momentum in the bearish zone.
Hourly RSI – The RSI for ETH/USD is now above the 50 level.
Major Support Level – $2,900
Major Resistance Level – $3,200
Disclaimer: The content of this article solely reflects the author's opinion and does not represent the platform in any capacity. This article is not intended to serve as a reference for making investment decisions.
You may also like
Shiba Inu rallies to $0.00001004 after exchange debut and Dubai expansion
Nvidia plans to invest $3 billion in SoftBank’s SB Energy, betting on OpenAI's Ohio data center project
Nvidia is reportedly in talks to invest up to $3 billion in SB Energy, a SoftBank subsidiary, as part of a supporting arrangement for providing around $100 billion in credit support to OpenAI's Ohio data center project. The investment is planned to be completed in two phases: $1.5 billion upon signing, and another $1.5 billion when SB Energy goes public—an IPO that could launch as soon as next month, aiming to raise at least $5 billion.
World Liberty Financial Nears Bank Charter After OCC Approval
Cardano Bulls Target $0.25 as Key Warning Signs Emerge

Crypto prices
More


