
Ethereum Price Plunge To $2K Imminent as Key Support Line Crumbles
Ethereum price extended losses and tested the $2,150 support. ETH is struggling to recover and might continue to move down toward the $2,000 support zone.
- Ethereum started a fresh decline below the $2,350 and $2,250 levels.
- The price is trading below $2,250 and the 100-hourly Simple Moving Average.
- There is a key bearish trend line forming with resistance near $2,240 on the hourly chart of ETH/USD (data feed via Kraken).
- The pair attempt a fresh increase if it clears the $2,240 and $2,280 levels.
Ethereum Price Extends Losses
Ethereum price remained in a bearish zone below the $2,400 pivot level. ETH extended its decline and traded below the $2,250 support level, like Bitcoin .
It even spiked below the $2,000 level. A new weekly low was formed near $2,165 and the price is now consolidating losses. There was a minor increase above the $2,220 level. The price tested the 23.6% Fib retracement level of the downward wave from the $2,480 swing high to the $2,165 low.
Ethereum is now trading below $2,250 and the 100-hourly Simple Moving Average . On the upside, the price is facing resistance near the $2,240 level. There is also a key bearish trend line forming with resistance near $2,240 on the hourly chart of ETH/USD.
The next hurdle could be $2,280, above which the price could aim for a decent recovery. The next major resistance is now near $2,360 or the 61.8% Fib retracement level of the downward wave from the $2,480 swing high to the $2,165 low.
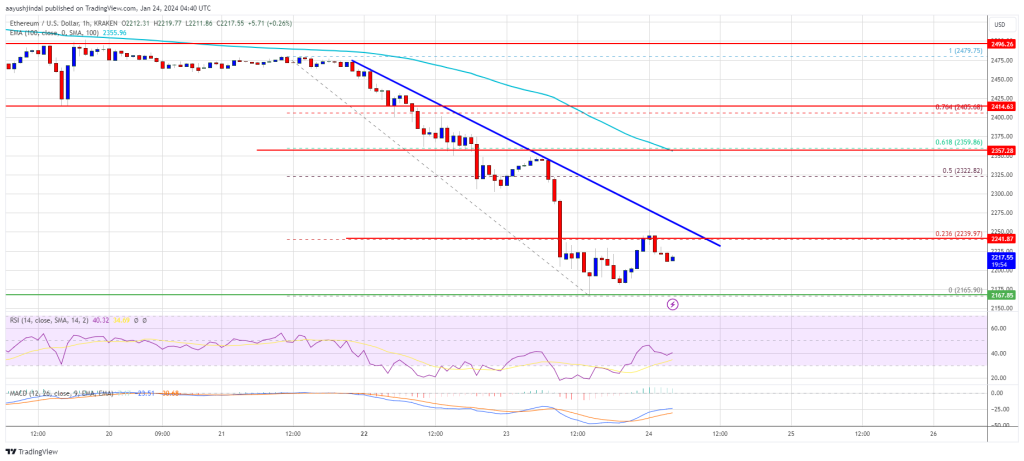
Source: ETHUSD on TradingView.com
A clear move above the $2,360 level might start a decent increase. In the stated case, the price could rise toward the $2,415 level. Any more gains might send the price toward the $2,550 zone.
More Losses in ETH?
If Ethereum fails to clear the $2,440 resistance, it could start another decline. Initial support on the downside is near the $2,200 level.
The next key support could be the $2,165 zone. A downside break below the $2,165 support might send the price further lower. In the stated case, Ether could test the $2,120 support. Any more losses might send the price toward the $2,000 level.
Technical Indicators
Hourly MACD – The MACD for ETH/USD is gaining momentum in the bearish zone.
Hourly RSI – The RSI for ETH/USD is now below the 50 level.
Major Support Level – $2,165
Major Resistance Level – $2,480
Disclaimer: The content of this article solely reflects the author's opinion and does not represent the platform in any capacity. This article is not intended to serve as a reference for making investment decisions.
You may also like
XRP breaks consolidation, whales add 190 million coins amid 22% weekly surge
Arbitrum RWA holders cross 10K – Can ARB extend its 16% rally?
3 Best Cryptos to Invest in August 2026 for Long-term Gains

Can the Bank of Japan's "twist operation" really suppress long-term interest rates? Goldman Sachs: Fiscal issues are the real root cause, and term premium may persist for a long time.
Goldman Sachs pointed out that the factors driving the recent rise in long-term U.S. yields include the U.S. fiscal deficit, inflation uncertainty, large-scale AI-related debt issuance, and market concerns about an increase in the equilibrium real interest rate. Meanwhile, Treasury repo operations and adjustments in issuance structure do not affect these factors. Therefore, Goldman Sachs believes that this intervention can only temporarily relieve pressure and cannot change the trend direction of long-term yields.
Crypto prices
More


