
SUI Soars 15% Daily, How High Can it Go? Three Things to Watch this Week (SUI Price Analysis)

SUI impressed today with its performance, but will it be enough?
Key Support levels: $1
Key Resistance levels: $1.4, $2
1. Strong Bounce at Key Support
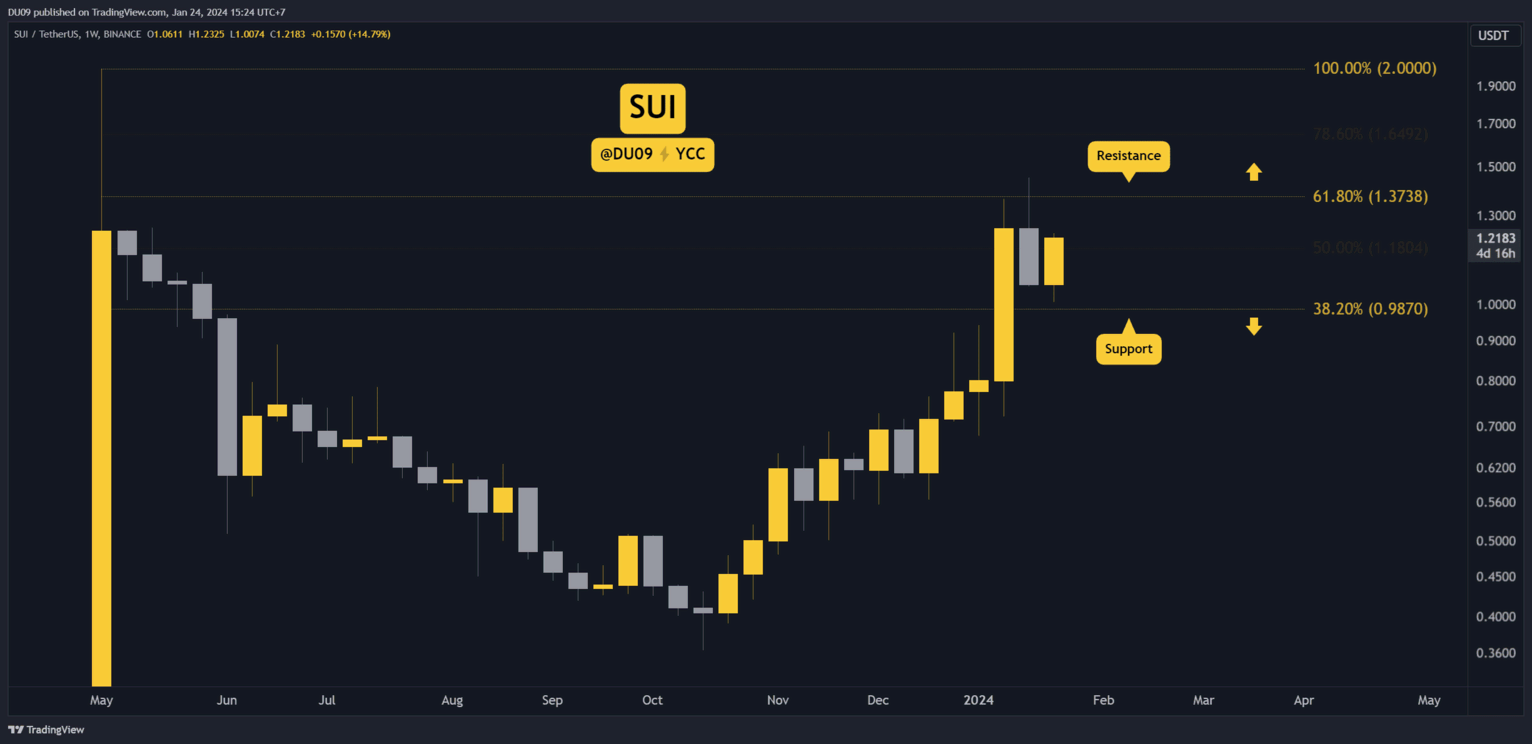
SUI managed to bounce well off the support at $1 and has since rallied by more than 20% from that level. This puts the key resistance at $1.4 as the immediate target.
2. Price Action is Bullish
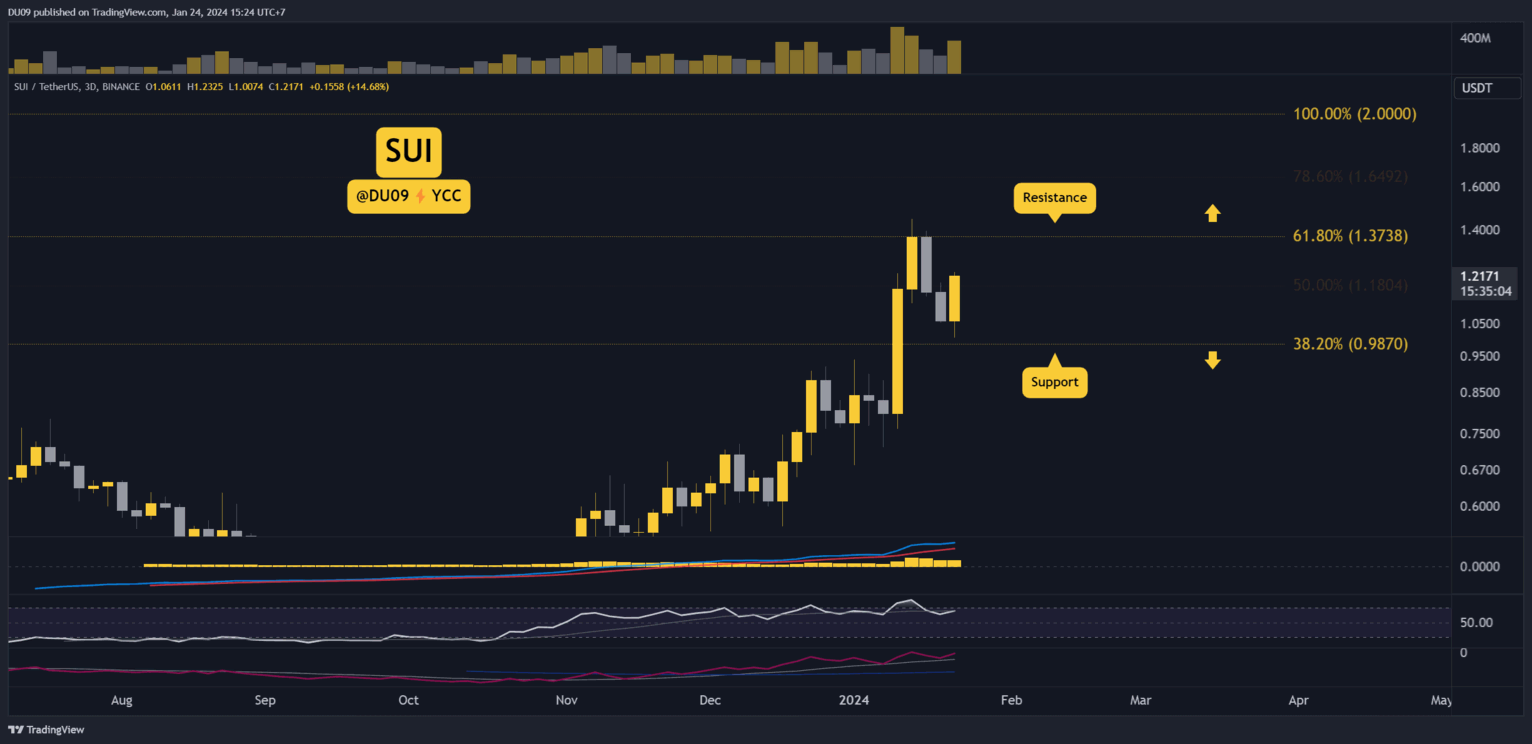
On the three-day chart, SUI is making higher highs and higher lows. As long as this continues, the bias will remain bullish. This will be re-confirmed if SUI breaks above the $1.4 resistance.
3. RSI Shows Strong Buy Pressure
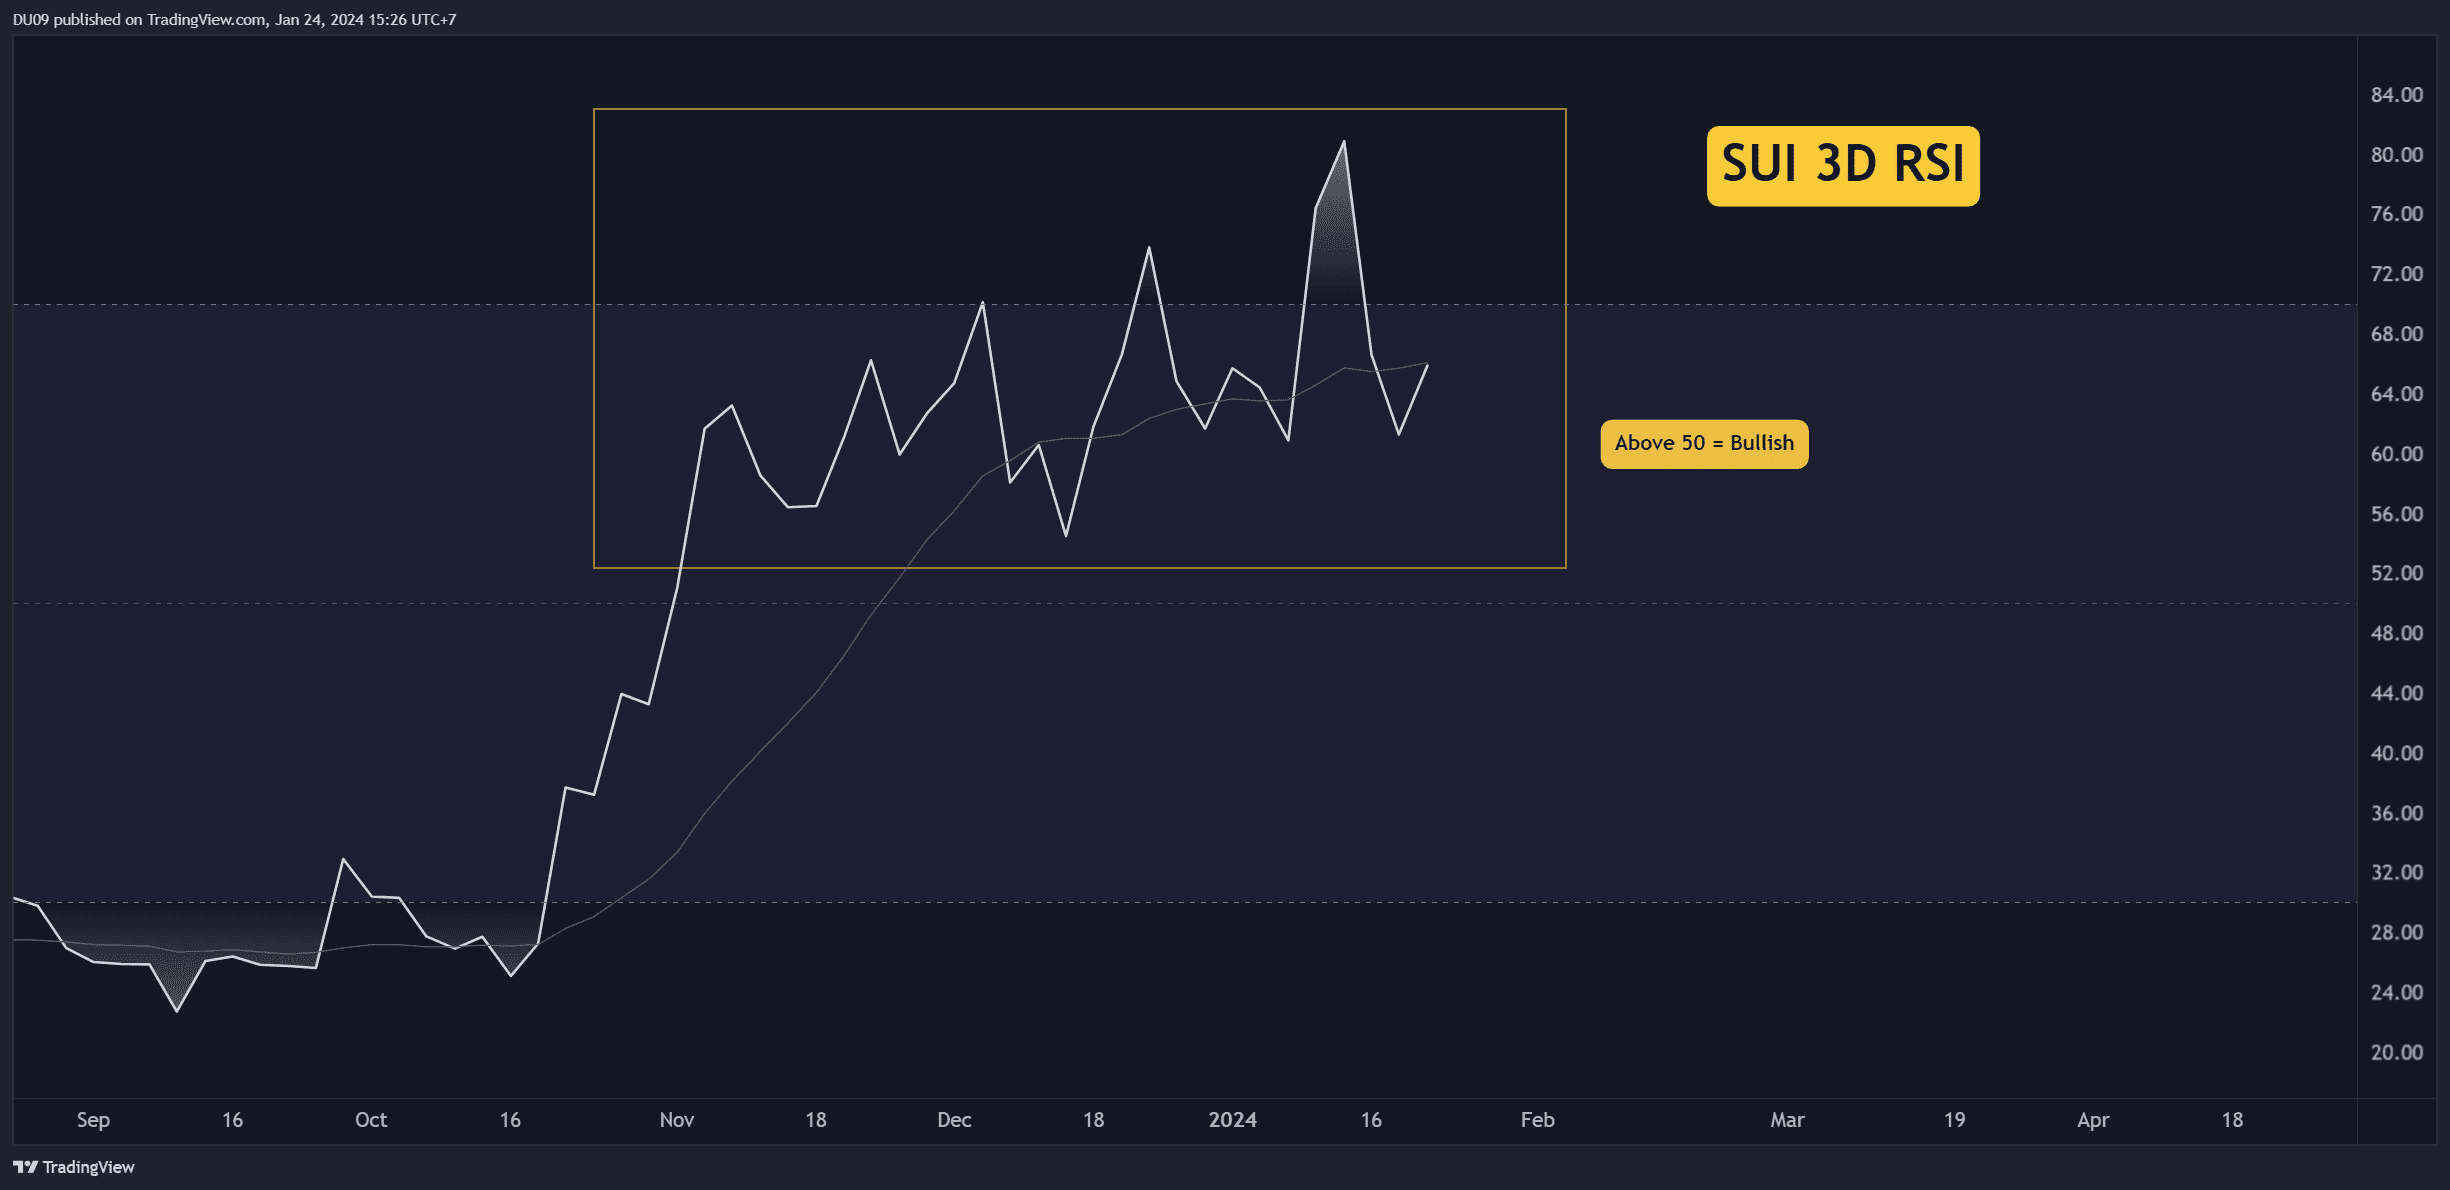
The 3-day RSI has been above 50 points for months. This is both bullish and indicative of continuation, particularly because it made a higher high at 80 points before this correction started. Now, it has also made a higher low.
Bias
The bias for SUI is bullish.
Short-Term Prediction for SUI Price
It’s important to watch the key resistance at $1.4. If broken, then SUI will be more likely to continue its rally and approach its all-time high at $2.
Disclaimer: The content of this article solely reflects the author's opinion and does not represent the platform in any capacity. This article is not intended to serve as a reference for making investment decisions.
You may also like
AI has "penetrated" the Federal Reserve! July meeting minutes mention it multiple times, with comprehensive influence from inflation to employment
From ordinary workers concerned about unemployment to investors warning of financial bubbles, the anxiety triggered by artificial intelligence is everywhere.

U.S. initial jobless claims unexpectedly fell to 206,000, adding more reason for the Federal Reserve to hold rates steady in September
The number of initial jobless claims in the United States fell slightly, indicating a stable job market.

U.S. Stocks Snap a Three-Day Losing Streak. Can the Rally Hold?

Crypto prices
More


