Robinhood Markets, Inc. stock surges to $108.16 amid crypto rally, RSI overbought
Robinhood Markets, Inc. stock surged to $108.16 on August 21, driving a sharp crypto-fueled rally. The daily range stretched from $98.80 to $109.70 after a 4.9% pre-market jump. That places the technical structure firmly in bullish territory.
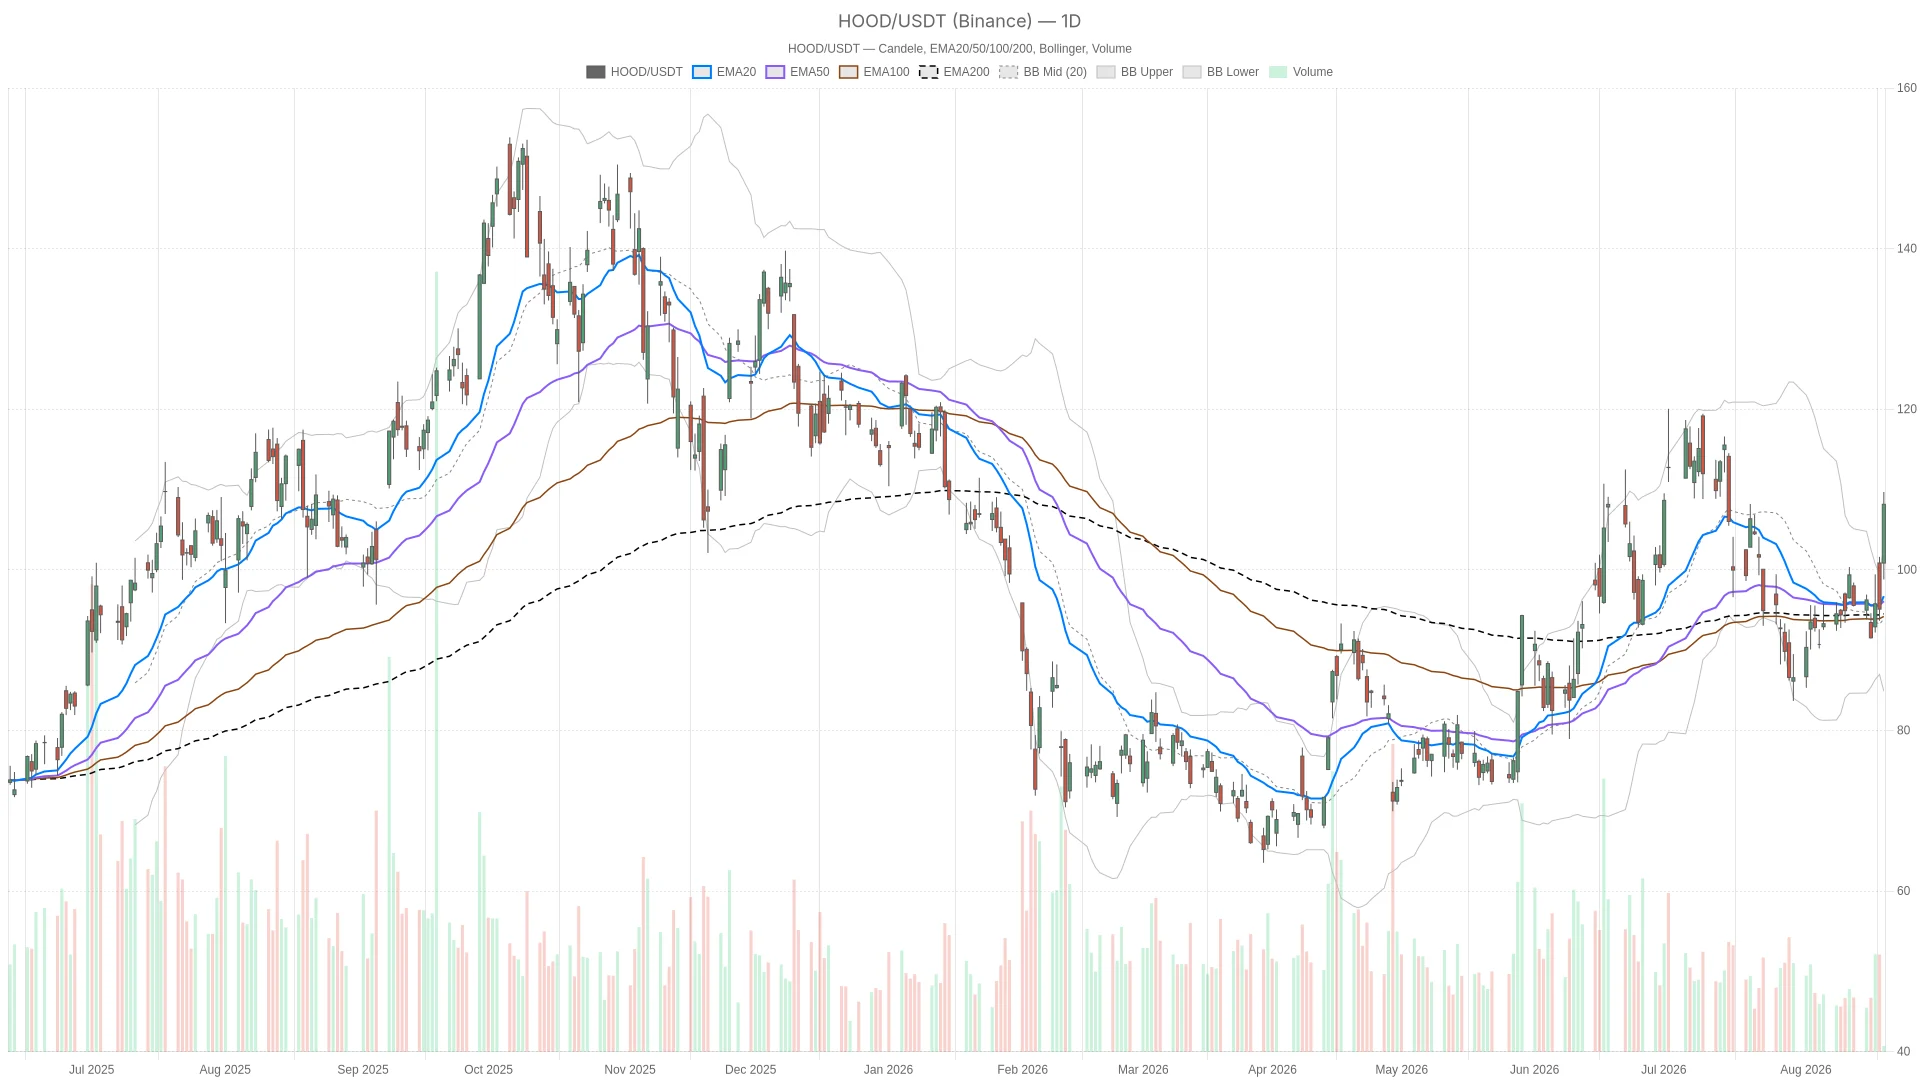 HOOD — daily chart with candlesticks, EMA20/EMA50 and volume.
 Summary
- Key takeaways
- Robinhood Markets, Inc. Stock Daily Chart: Decisively Bullish Trend
- Hourly Timeframe: Confirmation With a Warning Sign
- 15-Minute Execution View: Momentum Cooling Near Resistance
- What the News Flow Adds to the Picture
- Bullish Scenario
- Bearish Scenario
- Positioning and Volatility Outlook
- FAQ
Key takeaways
- HOOD stock closed at $108.16 on August 21 after a sharp rally spanning a $98.80–$109.70 daily range.
- The daily trend is decisively bullish, with price above EMA20, EMA50, and EMA200, backed by a fresh MACD crossover.
- Hourly RSI14 has reached overbought territory at 74.35, signaling elevated short-term risk despite the bullish structure.
- A 15-minute MACD bearish crossover suggests momentum is cooling near resistance around $108.74.
- Bitcoin strength and renewed crypto regulation optimism remain the primary catalysts behind the rally.
Robinhood Markets, Inc. Stock Daily Chart: Decisively Bullish Trend
The daily chart presents the clearest bullish signal, with price well above all three key moving averages and a fresh MACD crossover confirming upward momentum. Price sits above its EMA20 at $96.72, EMA50 at $96.09, and EMA200 at $94.52. That stacking order defines an uptrend. The spacing between price and the averages shows real conviction behind the move. RSI14 at 62.51 reflects strong bullish momentum without reaching overbought extremes above 70. In other words, there is still room for this move to extend.
Meanwhile, the daily MACD line has crossed above the signal (0.05 versus -1.19). The resulting histogram of 1.24 confirms a fresh bullish crossover. Price closed at $108.16, above the upper Bollinger Band of $102.89. That is a genuine volatility breakout rather than a routine band test. Historically, this kind of overshoot signals strong buying pressure. However, it also raises the odds of a short-term pause once the initial thrust cools.
At the same time, daily ATR14 at 5.27 indicates the stock is moving in wide, aggressive daily ranges. The pivot structure reinforces the bullish read: price trades above the daily pivot at $105.55. Resistance at R1 ($112.30) remains untested. Support at S1 ($101.40) sits well below current levels. Overall, the daily chart points toward continuation rather than exhaustion.
Hourly Timeframe: Confirmation With a Warning Sign
The hourly chart confirms the daily bullish bias but warns of overbought conditions, with RSI14 reaching 74.35. The EMA20 ($101.39), EMA50 ($98.16), and EMA200 ($97.81) are all stacked bullishly beneath the current price of $108.13. MACD is also constructive, with the line at 3.38 well above the signal at 2.12, producing a histogram of 1.26. However, RSI14 has reached 74.35, firmly in overbought territory. This complicates the daily bullish thesis rather than simply confirming it.
Price trades near the hourly Bollinger upper band of $111.29 but has not broken through it, unlike on the daily chart. The hourly pivot levels are tight: pivot at $107.76, resistance R1 at $108.74, and support S1 at $107.16. With price glued to that pivot and resistance zone, buyers remain in control. Still, they are working against an increasingly stretched momentum reading. Therefore, while the hourly trend agrees with the daily bias, the overbought RSI signals that chasing strength here carries elevated short-term risk.
15-Minute Execution View: Momentum Cooling Near Resistance
The 15-minute chart shows momentum cooling near resistance despite the intact bullish trend, with a short-term MACD bearish crossover now in play. The trend remains technically bullish. EMA20 ($106.65), EMA50 ($103.11), and EMA200 ($97.87) are aligned in the expected order. However, the MACD line (1.62) has slipped below its signal (2.10), producing a negative histogram of -0.49. That is a short-term bearish crossover, even as the broader trend stays intact.
Price hovers near the 15-minute Bollinger upper band of $108.88, right against pivot resistance at $108.74. This is a classic case of a higher timeframe trend running into short-term exhaustion. The 15-minute picture does not invalidate the daily or hourly bullish structure. However, it suggests the immediate move is losing steam. A consolidation or pullback may unfold before the next leg develops. For anyone timing entries, this is the layer that matters most right now, since it flags a pause rather than a reversal.
What the News Flow Adds to the Picture
The news backdrop reinforces the technical strength, with Bitcoin’s surge and renewed crypto regulation optimism driving the rally. Notably, the technical strength lines up closely with the news backdrop. Bitcoin’s surge has been lifting Robinhood alongside crypto-linked names such as Coinbase and Strategy. Renewed hopes around U.S. cryptocurrency regulation were cited directly as the catalyst behind Friday’s pre-market jump of nearly 4.9%. At the same time, CEO Vlad Tenev has been vocal about stock tokenization. He described it as an unstoppable force and urged the U.S. to move quickly in the space. That narrative adds a longer-term growth angle on top of the near-term crypto rally.
Not everyone is convinced, however. Tom Lee of Fundstrat Global Advisors has said HOOD stock is one to avoid in 2026. Meanwhile, another fund manager expressed confidence in Tenev and Robinhood’s next chapter. Competitor Webull posted a 13% rally on a record quarter driven by a day-trader rule change. However, reports note that growth was concentrated among existing customers rather than new account flow. Robinhood, by contrast, held steady through that news. This suggests the current rally is driven primarily by its own crypto exposure rather than competitive share shifts.
Bullish Scenario
The bullish case hinges on a sustained close above daily R1 at $112.30, confirming buyers are absorbing overbought hourly readings rather than being rejected. A sustained close above the daily R1 level of $112.30, combined with hourly price clearing its own resistance at $108.74, would confirm that buyers are absorbing the overbought hourly RSI. Continued strength in Bitcoin and further positive headlines on crypto regulation would provide the fundamental fuel for that follow-through. If the daily RSI stays below 70 while price grinds higher, the trend would have room to extend without immediately flashing exhaustion signals.
Bearish Scenario
The bearish risk starts with the 15-minute MACD bearish crossover already in play and would deepen on a break below the daily pivot at $105.55. A break below the 15-minute EMA20 at $106.65 and through the hourly pivot support at $107.16 would be the first sign that the pullback is deepening. More serious damage to the bullish thesis would require price to fall back below the daily pivot at $105.55. That would put the recent breakout in question. A slide toward the daily S1 support at $101.40 would represent a meaningful invalidation of the current bullish structure. Tom Lee’s cautious stance on HOOD stock, combined with any stalling in the broader crypto rally, would add weight to this downside path.
Positioning and Volatility Outlook
The daily trend in Robinhood Markets, Inc. stock remains the dominant, unambiguously bullish signal, though overbought hourly conditions warrant caution. The hourly timeframe confirms that trend but does so from an overbought position. Meanwhile, the 15-minute chart shows momentum already cooling near resistance. Given a daily ATR of 5.27, wide intraday swings should be expected regardless of direction.
Overall, with news flow tied so closely to Bitcoin’s price action and shifting regulatory sentiment, volatility is likely to stay elevated. The gap between bullish and bearish voices in the market only adds to the uncertainty around HOOD stock’s next move.
FAQ
What is the current trend for Robinhood Markets, Inc. stock?
The daily trend is decisively bullish. HOOD stock closed at $108.16 on August 21, trading above its EMA20 ($96.72), EMA50 ($96.09), and EMA200 ($94.52). A fresh daily MACD crossover and price closing above the upper Bollinger Band both confirm strong upward momentum.
Is HOOD stock overbought right now?
On the daily timeframe, RSI14 at 62.51 remains below the overbought threshold of 70, leaving room for further upside. However, the hourly RSI14 has reached 74.35, which is firmly overbought. This creates elevated short-term risk for anyone chasing the current strength.
What are the key levels to watch for HOOD stock?
Key resistance sits at the hourly R1 of $108.74 and the daily R1 at $112.30. On the downside, support levels include the hourly pivot at $107.16, the daily pivot at $105.55, and the daily S1 at $101.40.
What is driving the rally in Robinhood Markets, Inc. stock?
Bitcoin’s surge and renewed optimism over U.S. cryptocurrency regulation are the primary catalysts, pushing HOOD stock nearly 4.9% higher in pre-market trading. CEO Vlad Tenev’s advocacy for stock tokenization adds a longer-term growth narrative on top of the near-term crypto rally.
{"@context":"https://schema.org","@type":"FAQPage","mainEntity":[{"@type":"Question","name":"What is the current trend for Robinhood Markets, Inc. stock?","acceptedAnswer":{"@type":"Answer","text":"The daily trend is decisively bullish. HOOD stock closed at $108.16 on August 21, trading above its EMA20 ($96.72), EMA50 ($96.09), and EMA200 ($94.52). A fresh daily MACD crossover and price closing above the upper Bollinger Band both confirm strong upward momentum."}},{"@type":"Question","name":"Is HOOD stock overbought right now?","acceptedAnswer":{"@type":"Answer","text":"On the daily timeframe, RSI14 at 62.51 remains below the overbought threshold of 70, leaving room for further upside. However, the hourly RSI14 has reached 74.35, which is firmly overbought. This creates elevated short-term risk for anyone chasing the current strength."}},{"@type":"Question","name":"What are the key levels to watch for HOOD stock?","acceptedAnswer":{"@type":"Answer","text":"Key resistance sits at the hourly R1 of $108.74 and the daily R1 at $112.30. On the downside, support levels include the hourly pivot at $107.16, the daily pivot at $105.55, and the daily S1 at $101.40."}},{"@type":"Question","name":"What is driving the rally in Robinhood Markets, Inc. stock?","acceptedAnswer":{"@type":"Answer","text":"Bitcoin’s surge and renewed optimism over U.S. cryptocurrency regulation are the primary catalysts, pushing HOOD stock nearly 4.9% higher in pre-market trading. CEO Vlad Tenev’s advocacy for stock tokenization adds a longer-term growth narrative on top of the near-term crypto rally."}}]}
Article produced with the assistance of artificial intelligence and reviewed by the editorial team.






