
Analysis: Is Bitcoin’s 2026 Rally a True Cycle Turn or a 2019 Bear-Market Trap?
Cryptocurrency markets stand at a critical crossroads in late August 2026. Bitcoin (BTC) has mounted a sharp recovery, surging more than 20% in recent weeks to clear the $80,000 threshold. This rapid rise has pushed prices above key technical indicators, including the 200-day moving average and the Bull Market Support Band.
For retail traders, this sudden breakout feels like the official return of a bull market. However, institutional analysts, macro strategists, and active chartists view the move with measured caution.
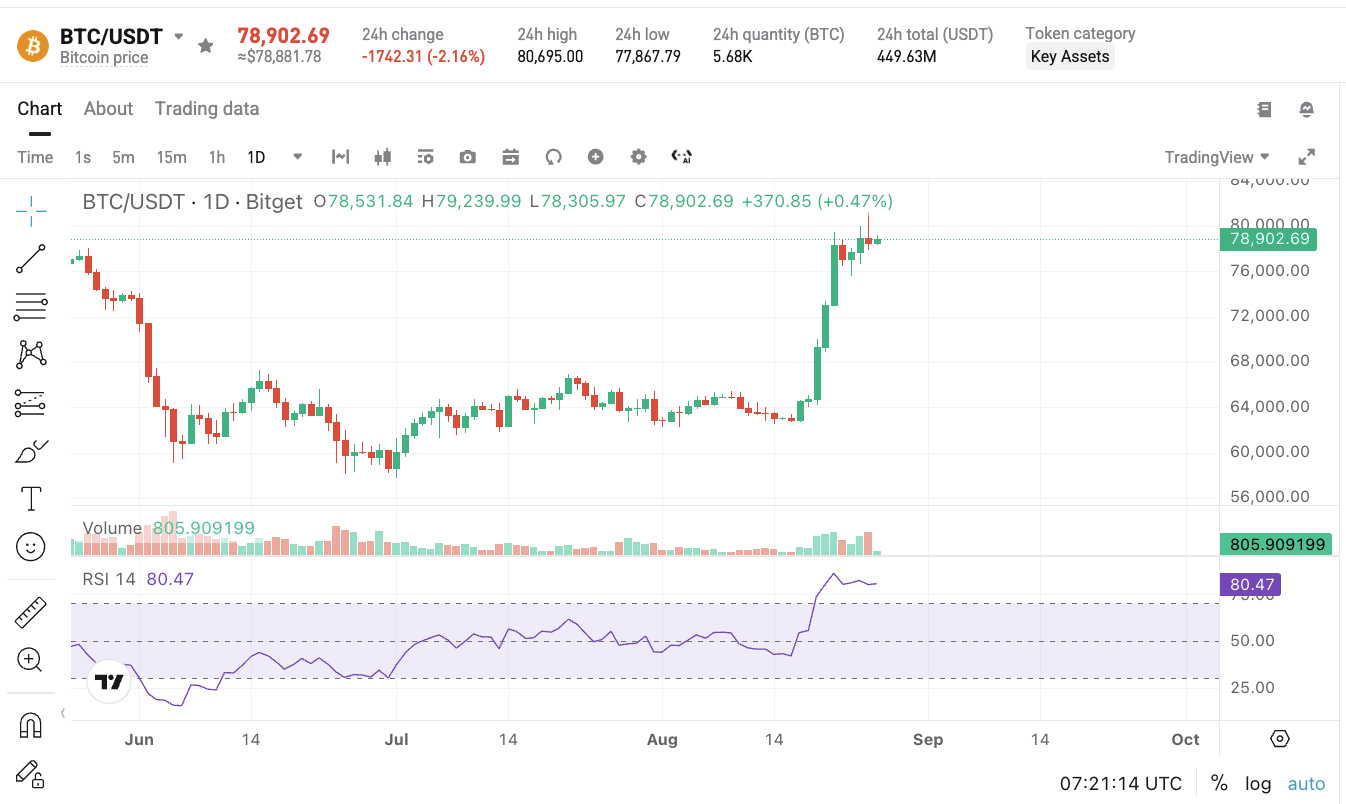
Historical chart patterns reveal striking structural parallels between August 2026 and October 2019. Both timeframes followed an "apathetic top"—a peak marked by weak momentum and minimal capital rotation into altcoins—coming shortly after the Federal Reserve concluded Quantitative Tightening (QT). In both instances, Bitcoin logged its first significant rally back above its 200-day moving average after a prolonged drop beneath it.
To evaluate whether this surge represents a true macro trend reversal or an elaborate bear-market trap, traders must analyze three key variables: Bitcoin’s moving-average structure, Ethereum’s macro valuation metrics, and Tether (USDT) dominance.
The Historical Analog: October 2019 vs. August 2026
To understand current market dynamics, investors must examine the market setup of late 2019.
| Metric / Factor |
2019 Historical Analog |
2026 Current Market |
| Fed Policy |
Federal Reserve QT Ends |
Federal Reserve Policy Shifts |
| Market Structure |
Apathetic Peak (No Altcoin Surge) |
Apathetic Top Liquidity Drain |
| Moving Average |
BTC Drops Below 200-Day SMA |
BTC Drops Below 200-Day SMA |
| Rebound Profile |
First Rebound: +17% to 18% Break |
Current Rebound: Sudden 20%+ Surge |
| Market Status |
Outcome: Rejection Final Shakeout |
Question: True Turn or Retest? |
In 2019, Bitcoin fell below its 200-day moving average following a high-conviction peak that failed to generate a broader altcoin rally. When Quantitative Tightening concluded, liquidity began to stabilize, sparking a sudden rally that carried Bitcoin roughly 17% to 18% above its 200-day moving average.
Many market participants interpreted that jump as an immediate signal to buy. Instead, the breakout lacked sustained buying volume. Prices stalled, retested lower levels, and eventually experienced a sharp final wash-out before a structural bull market took hold in 2020.
In August 2026, the market is replicating several key technical steps of that 2019 sequence:
- Duration Extension: If the preceding uptrend takes longer to form than in prior cycles, history shows that the subsequent consolidation or downtrend can also stretch out longer than expected.
- First Moving Average Breakout: The current push above $80,000 represents Bitcoin’s first sustained rally back over its 200-day simple moving average and Bull Market Support Band following an prolonged drop.
- News-Driven Momentum: Just as in 2019, the 2026 rally has been accompanied by positive macro headlines and short squeezes, triggering forced liquidations among bearish positions.
The Risk of Historical Echoes
A simple historical comparison tempers uncritical bullishness. If the market follows the 2019 blueprint, a brief push past long-term moving averages does not guarantee an immediate move toward new all-time highs. Instead, it often serves to exhaust short sellers while luring late buyers into high-leverage long positions right into structural resistance.
Quantitative Evaluation: BTC, ETH, and USDT Dominance
Determining whether the market is experiencing a true cycle turn requires tracking metrics across Bitcoin, Ethereum, and stablecoins.
1. Bitcoin: Resistance Bands and Candle Follow-Through
Bitcoin's move above $80,000 has placed price action directly inside a dense macro resistance band.
- The Follow-Through Rule: Historical data indicates that the single weekly candle breaking above a long-term moving average is rarely decisive on its own. The critical test occurs during the subsequent weekly and two-week candle closes.
- The 2018/2019 False Breakout Example: In July 2018, Bitcoin staged a rapid 30% rally, breaking key moving averages, only to give back those gains in the following candle. A similar fake-out occurred in late 2019.
- The Structural Requirement: For the current move to confirm a true trend change, Bitcoin must hold its breakout zone on weekly retests and maintain price action above its 50-week Exponential Moving Average (EMA). A quick failure back below the 200-day average would confirm a bear-market rally.
2. Ethereum: Fair Value Bands and Relative Weakness
Ethereum’s chart reveals a more fragile picture than Bitcoin’s direct price action.
- Logarithmic Regression Bands: ETH recently tested the bottom boundary of its long-term logarithmic regression channel near $1,500—a historical support region previously reached during market cycle lows in 2015, 2016, and 2019. The subsequent rebound pushed ETH back toward its mid-band "fair value" range around $2,300 to $2,500.
- The 200-Week Moving Average: ETH is colliding with its 200-week moving average, a technical line that capped upside attempts in mid-2024 and early 2025.
- Underperformance Against Hard Assets: While ETH has logged absolute gains in dollar terms, its valuations against gold and silver remain depressed. The ETH/Gold ratio has trended downward since 2021, printing lower lows than in 2022. Similarly, ETH’s ratio against silver remains near multi-year lows. This long-term trend indicates that ETH’s upside has largely been driven by fiat debasement rather than raw capital outperformance.
| Metric / Indicator |
Level / Status |
Context Macro Description |
| Log-Regression Floor |
Tagged near $1,500 |
Historical bottoming band (previously tagged in 2015, 2016, and 2019). |
| Current Location |
Rebounded to ~$2,300 – $2,500 |
Re-entered the mid-band "Fair Value" area. |
| Key Resistance |
200-Week Moving Average |
Major overhead technical boundary limiting upside momentum. |
| Relative Performance |
Underperforming Hard Assets |
Continues long-term downtrend against Gold since 2021; ETH/BTC ratio remains suppressed. |
3. USDT Dominance: The Ultimate Decider
Stablecoin dominance metrics—specifically Tether’s market share (USDT.D)—serve as a proxy for market risk appetite. When USDT dominance declines, capital is actively flowing out of cash reserves into crypto assets. When USDT dominance rises, investors are selling assets for cash.
| Stage |
Path A: True Breakout (Bullish) |
Path B: Bear Bounce (Bearish Trap) |
| Initial Trigger |
Stablecoin Dominance (USDT.D) breaks lower |
Stablecoin Dominance (USDT.D) bounces at support |
| Capital Market Reaction |
Capital flows actively into BTC and Altcoins |
Stock market undergoes a 10% to 20% correction |
| Macro Outcome |
Confirmed long-term cycle reversal |
Crypto experiences one final market drop |
- The Breakout Requirement: If the current rally marks a true macro bottom, USDT dominance must decisively break below its prevailing support levels.
- The 2022 Bounce Comparison: In May 2022, stablecoin dominance swept its local low before bouncing back into late Q4, leading to a final leg down for major crypto assets. In August 2026, USDT dominance has again swept a key low. If dominance bounces off this level rather than breaking down, it will signal that investors are using the rally to take profits back into cash.
Macro Interplay: Stock Market Seasonality and Crypto Liquidity
Crypto assets do not trade in isolation; they remain correlated with broad equity markets and interest rate expectations.
Midterm Year Equity Seasonality
Historical market data over three decades highlights a recurring seasonal trend in U.S. equities (SP 500) during mid-term election years:
- The Two-Dip Pattern: Midterm years frequently experience equity pullbacks at the beginning of the year, followed by a secondary correction in late Q3 or early Q4 (August through October).
- Historical Evidence: This two-dip pattern emerged during the midterm years of 2014, 2018, and 2022.
As of late August 2026, the SP 500 has experienced its early-year pullback and is currently trading near elevated levels around 7,650. The main macro risk facing digital assets is the occurrence of a standard late-Q3 or Q4 equity adjustment.
| SP 500 Scenario |
Projected Impact on ETH Altcoins |
| No Equity Correction |
70% probability macro low is confirmed in. |
| Mild Correction (~10% SP drop) |
~25% ETH drop; holds a higher low above $1,500 |
| Major Correction (~20% SP drop) |
~50% ETH drop; retests or undercuts low |
Detailed Scenario Analysis
Scenario 1: No Equity Correction (Bullish Continuation)
- Mechanics: The SP 500 breaks higher without a late-year retracement. Capital stays risk-on, and the Federal Reserve eases liquidity conditions.
- Crypto Impact: The odds that the cycle lows for Bitcoin ($57,700 in July) and Ethereum ($1,500) are fully established rise to approximately 70%. USDT dominance breaks lower, and altcoins begin a multi-quarter recovery.
Scenario 2: Mild Equity Pullback (~10% SP Drop)
- Mechanics: U.S. equities experience a routine 10% seasonal drop caused by shifting rate expectations or minor economic data misses.
- Crypto Impact: Historically, a 10% equity correction triggers a 20% to 25% pullback in Ethereum. Under this scenario, ETH would print a higher low, preserving its larger market structure. Bitcoin would likely retest its 200-day moving average from above, setting up a solid base for early 2027.
Scenario 3: Deep Equity Correction (~20% SP Drop)
- Mechanics: Broad equities drop 20%, returning to long-term trendlines due to tighter credit conditions or growth concerns.
- Crypto Impact: As seen in 2022 and early 2025, a 20% equity correction typically leads to a 50% drawdown in major altcoins like Ethereum. This scale of drop would push ETH back toward its $1,500 low or slightly under it, creating a final liquidating event before a sustainable macro recovery into 2027 and 2028.
A Diagnostic Framework for Evaluating the Breakout
Active traders should use a structured, metric-driven framework to evaluate market data rather than relying on sentiment or headlines.
| Metric / Indicator |
Bullish Confirmation Signal |
Bearish Trap / Fakeout Signal |
Current August 2026 Status |
| BTC 200-Day Moving Average |
Holds as support on multi-week retests |
Quick rejection back below average |
Testing Breakout Zone ($80k+) |
| Two-Week Candle Close |
Strong follow-through volume |
Immediate bearish engulfing candle |
In-Progress (Awaiting Close) |
| USDT Dominance (USDT.D) |
Clean breakdown past multi-month support |
Strong bounce off lower support band |
Swept Lows; Neutral-At-Risk |
| ETH / BTC Ratio |
Sustained multi-month breakout above 20-EMA |
Quick rejection; relative weakness resumes |
Testing Resistance Range |
| SP 500 Correlation |
Stable equity market; no Q3/Q4 sell-off |
Equity pullback (>10%) triggers crypto panic |
Trading near high levels (~7,650) |
Active Trader's Take: Tempering Euphoria with Discipline
The historical analogs from 2019 and 2022 provide a clear lesson: momentum alone is not structural confirmation.
While Bitcoin’s move past $80,000 demonstrates strong short-term buying pressure, rallies occurring directly after quantitative tightening phases often encounter significant friction.
| Active Trader Execution Checklist |
| ☐ Avoid chasing green breakout candles inside historical resistance zones. |
| ☐ Monitor USDT dominance for confirmation of sustained capital deployment. |
| ☐ Require weekly candle closes above the 200-day SMA to validate support. |
| ☐ Factor broad equity seasonal risks (late Q3/Q4) into leverage management. |
| ☐ Prepare structural allocation plans for the projected 2027–2028 cycle. |
Strategic Positioning Guidelines
- Avoid Over-Leverage at Resistance: Chasing market moves inside high-volume resistance bands exposes accounts to significant liquidations if price action reverses.
- Focus on Confirmation Over Speed: Waiting for two-week candle closes above key moving averages may mean missing the very bottom, but it significantly improves the probability of capturing a real trend.
- Track Capital Flows via USDT Dominance: If USDT dominance fails to break down, reduce risk exposure. A bounce in stablecoin market share often precedes equity market pullbacks.
- Maintain Perspective on the Multi-Year Horizon: Even if the market experiences a late-2026 pullback or retest, long-term indicators point toward a broader structural expansion building into 2027 and 2028.
By treating the late-August surge as a conditional test rather than a guaranteed reversal, active traders can navigate volatile market conditions with clarity and control.
Conclusion: Navigating the 2019 Parallel
The rally in late August 2026 has provided a much-needed surge of bullish momentum, carrying Bitcoin above its $80,000 threshold and pushing major assets past long-standing technical hurdles. However, as the structural parallels to October 2019 demonstrate, clearing a 200-day moving average is only the first phase of a true market reversal—not the final confirmation.
Whether this move marks a genuine macro bottom or an elaborate bear-market bounce depends on three key factors over the coming weeks:
- Confirmation over momentum: Bitcoin must demonstrate sustained weekly follow-through above its moving average support bands rather than suffering a swift rejection.
- Capital deployment: USDT dominance must decisively break below support to confirm that sidelined cash is actively returning to risk assets.
- Macro resilience: Crypto markets must navigate potential Q3/Q4 U.S. equity seasonal corrections without breaking local market structures.
If stablecoin dominance breaks down and broad equities hold stable, the foundation for a broad market recovery into 2027 and 2028 will be firmly established. Conversely, if equities experience a seasonal dip and USDT dominance bounces, the market may face one final retest before a lasting bull trend takes hold. By anchoring trading strategies to objective market data rather than emotional price swings, investors can position themselves effectively for whichever path the market takes.
Disclaimer: The opinions expressed in this article are for informational purposes only. This article does not constitute an endorsement of any of the products and services discussed or investment, financial, or trading advice. Qualified professionals should be consulted prior to making financial decisions.


- The Historical Analog: October 2019 vs. August 2026
- Quantitative Evaluation: BTC, ETH, and USDT Dominance
- Macro Interplay: Stock Market Seasonality and Crypto Liquidity
- A Diagnostic Framework for Evaluating the Breakout
- Active Trader's Take: Tempering Euphoria with Discipline
- Conclusion: Navigating the 2019 Parallel