
2026 U.S. Midterm Elections Investment Guide: S&P 500 Performance in the Six Months After the Election and Trading Opportunities
As the U.S. midterm elections draw closer, Wall Street’s attention is focused not only on the election outcome itself, but also on the potential market turning points that may emerge afterward.
From a historical perspective, U.S. equities are approaching a particularly noteworthy seasonal window: the six months following a midterm election have often been among the strongest periods for the SP 500 Index. Since the SP 500 was introduced in 1957, the period from November after a midterm election through April of the following year has never recorded a negative return.
This raises an important question for traders: as political uncertainty gradually fades, could markets see a renewed increase in risk appetite?
For CFD traders, however, the key is not simply predicting whether the market will rise or fall. It is about finding a more disciplined trading approach amid potential trends, headline-driven volatility, and risk management considerations.
The Six Months After a Midterm Election: Why Is It a Seasonal Highlight for U.S. Stocks?
A U.S. presidential term generally follows a four-year cycle, with midterm elections taking place in the second year of that term. Historical data suggest that, within this cycle, market performance after a midterm election has often stood out compared with the same period in other years.
Relevant historical statistics show that:
-
From November after a midterm election through April of the following year, the SP 500 has historically performed significantly better than average.
-
Since 1957, no negative-return period has been recorded during this six-month window.
-
Even when U.S. stocks performed strongly in the six months leading up to the election, the post-election seasonal advantage did not appear to diminish significantly in historical data.
Of course, a “100% historical record” does not mean the market is guaranteed to rise in the future. The sample size is limited, market structures evolve, and inflation, interest rates, corporate earnings, geopolitics, and unexpected events can all reshape established seasonal patterns.
For traders, the value of such data is not in offering certainty. Instead, it provides a market framework worth monitoring: if post-election uncertainty declines and fundamentals do not deteriorate significantly, improving sentiment toward risk assets could become an important market driver.
Declining Political Uncertainty Often Marks the Start of Market Repricing
Why do U.S. stocks often attract greater market interest after midterm elections? one key factor may be the decline in political uncertainty.
Before an election, markets often face a range of unresolved questions, including:
-
How might control of the House and Senate change?
-
Could fiscal spending, taxation, and regulatory policies shift?
-
Might sectors such as healthcare, energy, technology, finance, and defense face new policy risks?
-
Could government budgets, debt-ceiling negotiations, or policy implementation become more gridlocked?
When uncertainty rises, businesses and investors tend to delay decisions, while capital may shift toward more defensive assets. Once election results are announced, the outcome may not fully match market expectations, but at least some policy pathways become easier to assess. This can allow markets to begin repricing assets.
In other words, markets may not need the “ideal outcome”; they often need a “clearer answer.”
Post-Election Markets Are Not Just About the Broad Index—Watch Policy-Sensitive Sectors
Midterm election results may affect more than the overall direction of the SP 500 or Nasdaq. They can also widen performance gaps among different sectors.
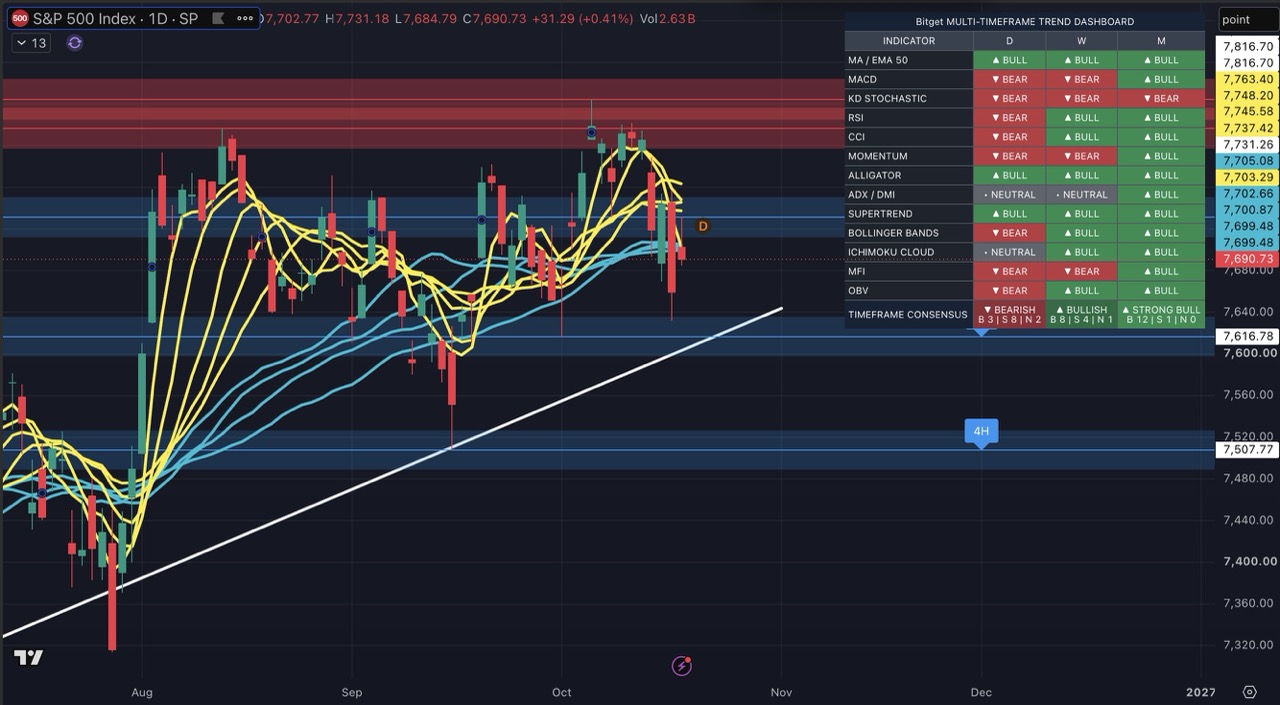
Traders may want to pay particular attention to the following areas:
Technology and Growth Stocks
If market sentiment turns more optimistic regarding interest rates, regulation, or corporate capital expenditure, technology and growth sectors are often more sensitive to improving risk appetite. However, highly valued stocks may also experience sharp volatility when earnings reports or policy headlines emerge.
Financial Stocks
Financial stocks are highly sensitive to the yield curve, the regulatory environment, economic growth, and credit risk. If the election outcome gives markets greater clarity on fiscal policy and the economic outlook, banks, insurers, and capital-market-related assets may present new trading opportunities.
Energy and Industrial Stocks
Energy policy, infrastructure spending, defense budgets, and manufacturing reshoring are all themes that could bring energy, industrial, and materials sectors into focus after the election.
Defensive Sectors
Even if political uncertainty declines, capital may still rotate toward defensive sectors—such as healthcare, consumer staples, and utilities—if economic data weakens, earnings forecasts are revised downward, or inflationary pressure resurfaces.
Therefore, the key question is not simply whether U.S. stocks will rise. It is also: which indices and sectors will attract capital, and which market scenario is gradually becoming reality?
For CFD Traders: Opportunity Comes From Volatility, but Discipline Determines the Outcome
Around midterm elections, market volatility can intensify due to polling data, policy comments, vote-counting progress, and post-election interpretations. For CFD traders, this may create more instruments and market opportunities to watch, but it also means elevated risk.
Traders may consider the following approaches:
-
Track major U.S. equity indices: Monitor instruments linked to the SP 500, Nasdaq 100, and Dow Jones Industrial Average to assess whether a post-election trend is developing.
-
Watch sector rotation: Use policy direction, capital flows, and corporate earnings to evaluate whether strong sectors can sustain their momentum.
-
Set clear risk controls: During major election and policy events, avoid excessive exposure caused by sharp short-term price swings.
-
Do not rely on seasonality alone: Historical statistics should serve as a reference, not as the sole basis for entry and exit decisions. Technical factors, fundamentals, and event risks should also be evaluated.
-
Apply both long and short perspectives: CFDs can be used to express different market views, but short selling also carries significant risk. Stop-loss orders and leverage control are essential.
Seasonal market patterns offer a potential probability advantage, not a trading guarantee. Especially in highly volatile conditions, consistently following a trading plan and managing position size can be more important than making a single directional call.
Conclusion: The Post-Election “Tailwind” Is Worth Watching, but Risk Management Remains Essential
Historically, the six months following a midterm election have been a relatively strong period for U.S. equities. Lower political uncertainty, greater clarity on policy direction, and the often-improving risk appetite from year-end into the start of the following year may all create favorable market conditions.
However, markets do not follow a fixed script simply because of one historical statistic. With elections, interest rates, inflation, corporate earnings, and geopolitics all influencing price action, traders should treat historical win rates as a starting point for analysis—not as a reason to overlook risk.
Want to follow U.S. equity indices, trending sectors, and global market volatility around the U.S. midterm elections? Explore diverse market movements through Bitget CFD and flexibly identify long and short opportunities based on your own strategy.
Visit Bitget CFD to explore market opportunities. Before trading, make sure you understand CFDs and leveraged trading, set appropriate stop-loss levels, assess your risk tolerance, and trade only with funds you can afford to lose. CFDs are high-risk products, and past performance is not indicative of future results.
All trading education provided by Bitget is for educational purposes only and should not be considered financial advice. The strategies and examples shared are for reference only and may not reflect actual market conditions. CFD trading involves significant risk, including the potential loss of capital. Past performance does not guarantee future results. Please conduct thorough research and ensure that you understand the risks involved. Bitget is not responsible for any trading decisions made by users.


- The Six Months After a Midterm Election: Why Is It a Seasonal Highlight for U.S. Stocks?
- Declining Political Uncertainty Often Marks the Start of Market Repricing
- Post-Election Markets Are Not Just About the Broad Index—Watch Policy-Sensitive Sectors
- For CFD Traders: Opportunity Comes From Volatility, but Discipline Determines the Outcome
- Conclusion: The Post-Election “Tailwind” Is Worth Watching, but Risk Management Remains Essential