MARA Holdings, Inc. stock surges 15.54% to $11.15 on Clarity Act hopes
MARA Holdings, Inc. stock closed Thursday at $11.15 after a 15.54% surge. The rally followed President Trump’s renewed push for Congress to speed passage of the Clarity Act. Yet the daily chart remains cautious: price closed above its 20-day EMA but below the 50-day and 200-day EMAs.
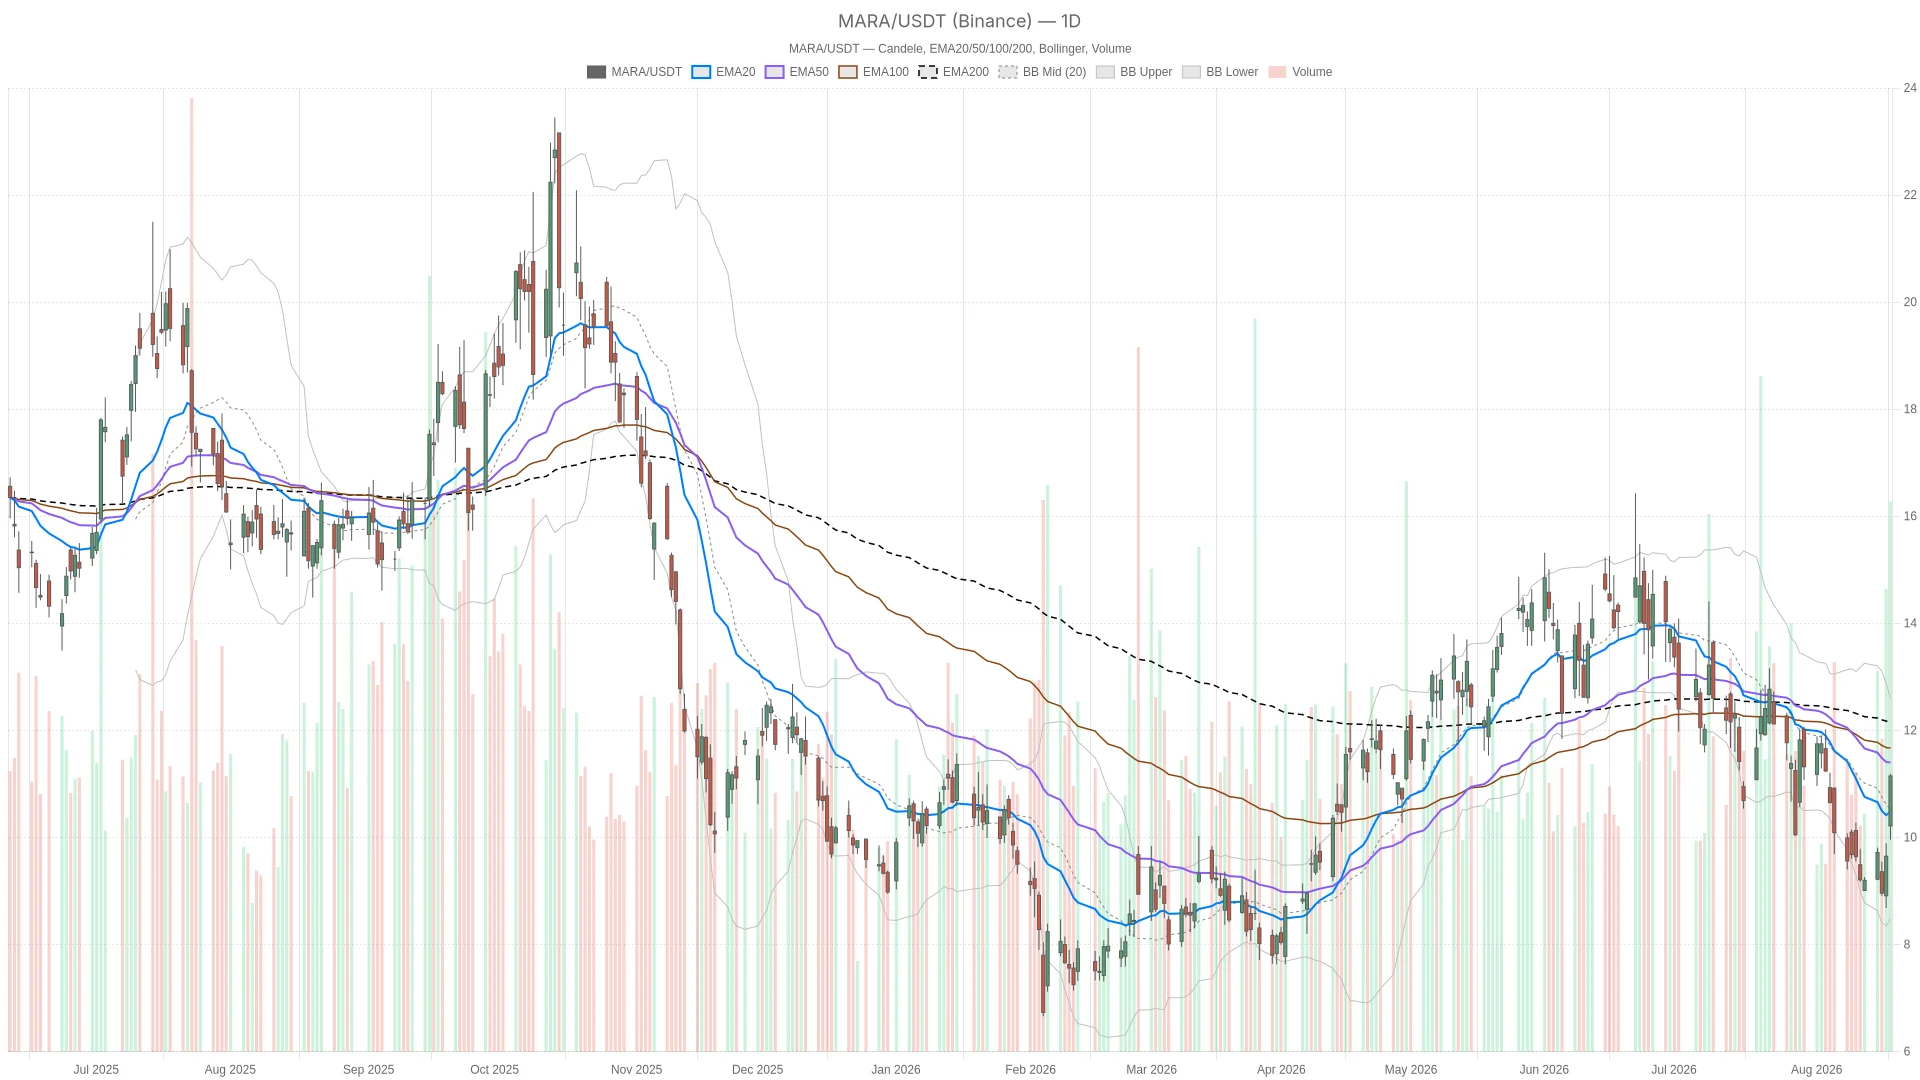 MARA — daily chart with candlesticks, EMA20/EMA50 and volume.
 Summary
- Key takeaways
- MARA Holdings, Inc. Stock Daily Structure: Still Below Key Averages
- 1H Timeframe: Bullish Momentum Meets Overbought Conditions
- 15-Minute Execution Context
- Bullish Scenario: Holding Above $10.77 and Clearing $11.19–$11.25
- Bearish Scenario: Overbought Readings and Resistance Rejection
- Closing Take: Timeframes Disagree at an Inflection Point
- FAQ
Key takeaways
- MARA Holdings, Inc. stock closed Thursday at $11.15, up 15.54%, after renewed Clarity Act momentum.
- Price holds above the 20-day EMA at 10.49 but remains below the 50-day EMA at 11.40 and the 200-day EMA at 12.16.
- Hourly RSI14 reads 74.96 and 15-minute RSI14 reads 71.52, both in overbought territory.
- The daily MACD histogram just turned positive at 0.07, an early sign of fading downside momentum.
- CEO Fred Thiel sold $253,000 in shares around this period.
MARA Holdings, Inc. Stock Daily Structure: Still Below Key Averages
MARA Holdings, Inc. stock is still trading below its key daily averages despite the sharp rally. The close above the 20-day EMA at 10.49 improves the short-term picture, but the 50-day and 200-day EMAs remain overhead.
On the daily timeframe, MARA closed at 11.15 after ranging between 9.96 and 11.19. Volume reached near 79.9 million shares. The 20-day EMA sits at 10.49, while the 50-day EMA at 11.40 and the 200-day EMA at 12.16 remain overhead. This stacking is typical of a market repairing a downtrend rather than one already in a confirmed uptrend.
Daily Momentum and Volatility Context
RSI14 on the daily chart reads 52.35, essentially neutral. That leaves room for further upside without flashing overbought risk. MACD is slightly more constructive: the line sits at -0.65 against a signal of -0.73, producing a histogram of 0.07. The histogram just turned positive, an early sign that downside momentum is fading, though the indicator remains below zero.
On the volatility side, the daily Bollinger setup shows price near the mid-band at 10.54. The upper band sits at 12.60 and the lower band at 8.47, so the setup is not stretched in either direction. ATR14 stands at 0.80, confirming that daily volatility has expanded around this move. The daily pivot sits at 10.77, with resistance at 11.57 (R1) and support at 10.34 (S1). Thursday’s close above the pivot keeps the near-term bias tilted constructive.
1H Timeframe: Bullish Momentum Meets Overbought Conditions
The 1-hour chart confirms a bullish thrust, but it does so from a stretched position. Price is above all three hourly EMAs, yet RSI14 is firmly overbought.
Price at 11.15 sits above the 20-hour EMA at 10.13, the 50-hour EMA at 9.89, and the 200-hour EMA at 10.98. That is a fully bullish stack. RSI14 on this timeframe reads 74.96, firmly in overbought territory. MACD confirms the thrust, with the line at 0.42 above a signal of 0.25 and a positive histogram of 0.17. That is clean bullish momentum in the near term.
Stretch and Pullback Risk
However, the overbought RSI reading is worth flagging. Price is trading near the upper Bollinger band at 11.36, against a mid-band of 9.84 and a lower band of 8.32. That typically signals the move has stretched quickly rather than gradually. The hourly pivot sits at 11.09, with R1 at 11.25 and S1 at 10.98. Current price sits in the middle of that tight range. In short, the 1H timeframe confirms the bullish attempt but raises the odds of a pause or pullback before any continuation.
15-Minute Execution Context
The 15-minute chart remains outright bullish, but intraday momentum is cooling near resistance. Price holds above all three short-term EMAs, while MACD flattens as price presses the top of its volatility envelope.
On the 15-minute chart, price sits above the 20, 50, and 200-period EMAs at 10.75, 10.30, and 9.86 respectively. RSI14 at 71.52 remains elevated, echoing the hourly overbought condition. Notably, MACD is starting to flatten. The line at 0.24 sits just under the signal at 0.25, producing a slightly negative histogram of -0.01. That subtle divergence suggests intraday momentum is cooling exactly as price approaches resistance.
Bollinger bands here are tight, with the mid-band at 10.81 and the upper band at just 11.09. Price is effectively pressing against the top of its short-term volatility envelope. The 15-minute pivot at 11.09 and R1 at 11.25 align closely with the hourly resistance cluster. Therefore, the $11.19–$11.25 zone is the key short-term battleground for execution.
Bullish Scenario: Holding Above $10.77 and Clearing $11.19–$11.25
The bullish case requires a hold above the daily pivot at 10.77 and a clear break of the 11.19–11.25 resistance cluster. A confirmed move through the daily 50-EMA at 11.40 would then open the path toward R1 at 11.57.
Beyond that, the 200-day EMA near 12.16 becomes the next reference. The Clarity Act catalyst gives bulls a fundamental narrative to lean on. Meanwhile, a daily MACD histogram that just turned positive supports the idea that downside pressure is easing. Continued volume alongside the crypto-policy tailwind would be the clearest confirmation this leg has legs beyond a single news-driven spike.
Bearish Scenario: Overbought Readings and Resistance Rejection
On the other hand, the bearish case rests on overbought readings across both the 1-hour and 15-minute timeframes. A rejection at the 11.19–11.25 resistance zone could trigger a pullback toward the daily pivot at 10.77 or even S1 at 10.34.
A failure to hold above the daily 20-EMA at 10.49 would reopen the broader bearish structure. Price would then be trading beneath every meaningful daily moving average. In addition, MARA Holdings CEO Fred Thiel sold $253,000 in shares around this period. That is a modest but relevant data point for those tracking insider positioning alongside the technical picture.
Closing Take: Timeframes Disagree at an Inflection Point
MARA Holdings, Inc. stock sits at an inflection point where timeframes disagree. The daily chart shows a market still repairing a longer-term downtrend, while the 1-hour and 15-minute charts show stretched bullish alignment.
Overall, the daily chart keeps price trapped between a firming 20-EMA and a still-overhead 50-EMA and 200-EMA. In contrast, the intraday timeframes show clean bullish alignment with RSI readings stretched into overbought territory on both. As a result, the setup favors caution around the immediate resistance zone near 11.19–11.25, even as the broader daily bias improves incrementally.
With ATR still elevated and a news-driven catalyst behind the move, volatility is likely to remain high in either direction. Positioning should account for the possibility of a sharp reversal as much as continuation.
FAQ
Why did MARA Holdings, Inc. stock jump on Thursday?
The stock rose 15.54% to close at $11.15. The move followed news that President Trump renewed his push for Congress to speed up passage of the Clarity Act. That catalyst reignited buying interest across crypto-linked names.
Is MARA Holdings, Inc. stock in a confirmed uptrend?
Not yet. Price closed above the 20-day EMA at 10.49, but it remains below the 50-day EMA at 11.40 and the 200-day EMA at 12.16. That structure is more typical of a market repairing a downtrend.
What is the key resistance zone for MARA?
The 11.19–11.25 zone is the key short-term battleground. It aligns with the hourly and 15-minute resistance clusters. Above that, the daily 50-EMA at 11.40 and R1 at 11.57 are the next references.
What overbought signals are present on the chart?
Hourly RSI14 reads 74.96 and 15-minute RSI14 reads 71.52, both in overbought territory. The 15-minute MACD is also flattening just below its signal, suggesting intraday momentum is cooling near resistance.
{"@context":"","@type":"FAQPage","mainEntity":[{"@type":"Question","name":"Why did MARA Holdings, Inc. stock jump on Thursday?","acceptedAnswer":{"@type":"Answer","text":"The stock rose 15.54% to close at $11.15. The move followed news that President Trump renewed his push for Congress to speed up passage of the Clarity Act. That catalyst reignited buying interest across crypto-linked names."}},{"@type":"Question","name":"Is MARA Holdings, Inc. stock in a confirmed uptrend?","acceptedAnswer":{"@type":"Answer","text":"Not yet. Price closed above the 20-day EMA at 10.49, but it remains below the 50-day EMA at 11.40 and the 200-day EMA at 12.16. That structure is more typical of a market repairing a downtrend."}},{"@type":"Question","name":"What is the key resistance zone for MARA?","acceptedAnswer":{"@type":"Answer","text":"The 11.19–11.25 zone is the key short-term battleground. It aligns with the hourly and 15-minute resistance clusters. Above that, the daily 50-EMA at 11.40 and R1 at 11.57 are the next references."}},{"@type":"Question","name":"What overbought signals are present on the chart?","acceptedAnswer":{"@type":"Answer","text":"Hourly RSI14 reads 74.96 and 15-minute RSI14 reads 71.52, both in overbought territory. The 15-minute MACD is also flattening just below its signal, suggesting intraday momentum is cooling near resistance."}}]}
Article produced with the assistance of artificial intelligence and reviewed by the editorial team.






