Avalanche Price Today: AVAX Stuck at $6.34 as Daily Downtrend Holds
As of August 19, 2026, the Avalanche price today sits at $6.34, pinned almost exactly on its daily pivot of $6.35. That stillness is deceptive, though: the daily chart tells a far more one-sided story than the 1-hour or 15-minute charts do.
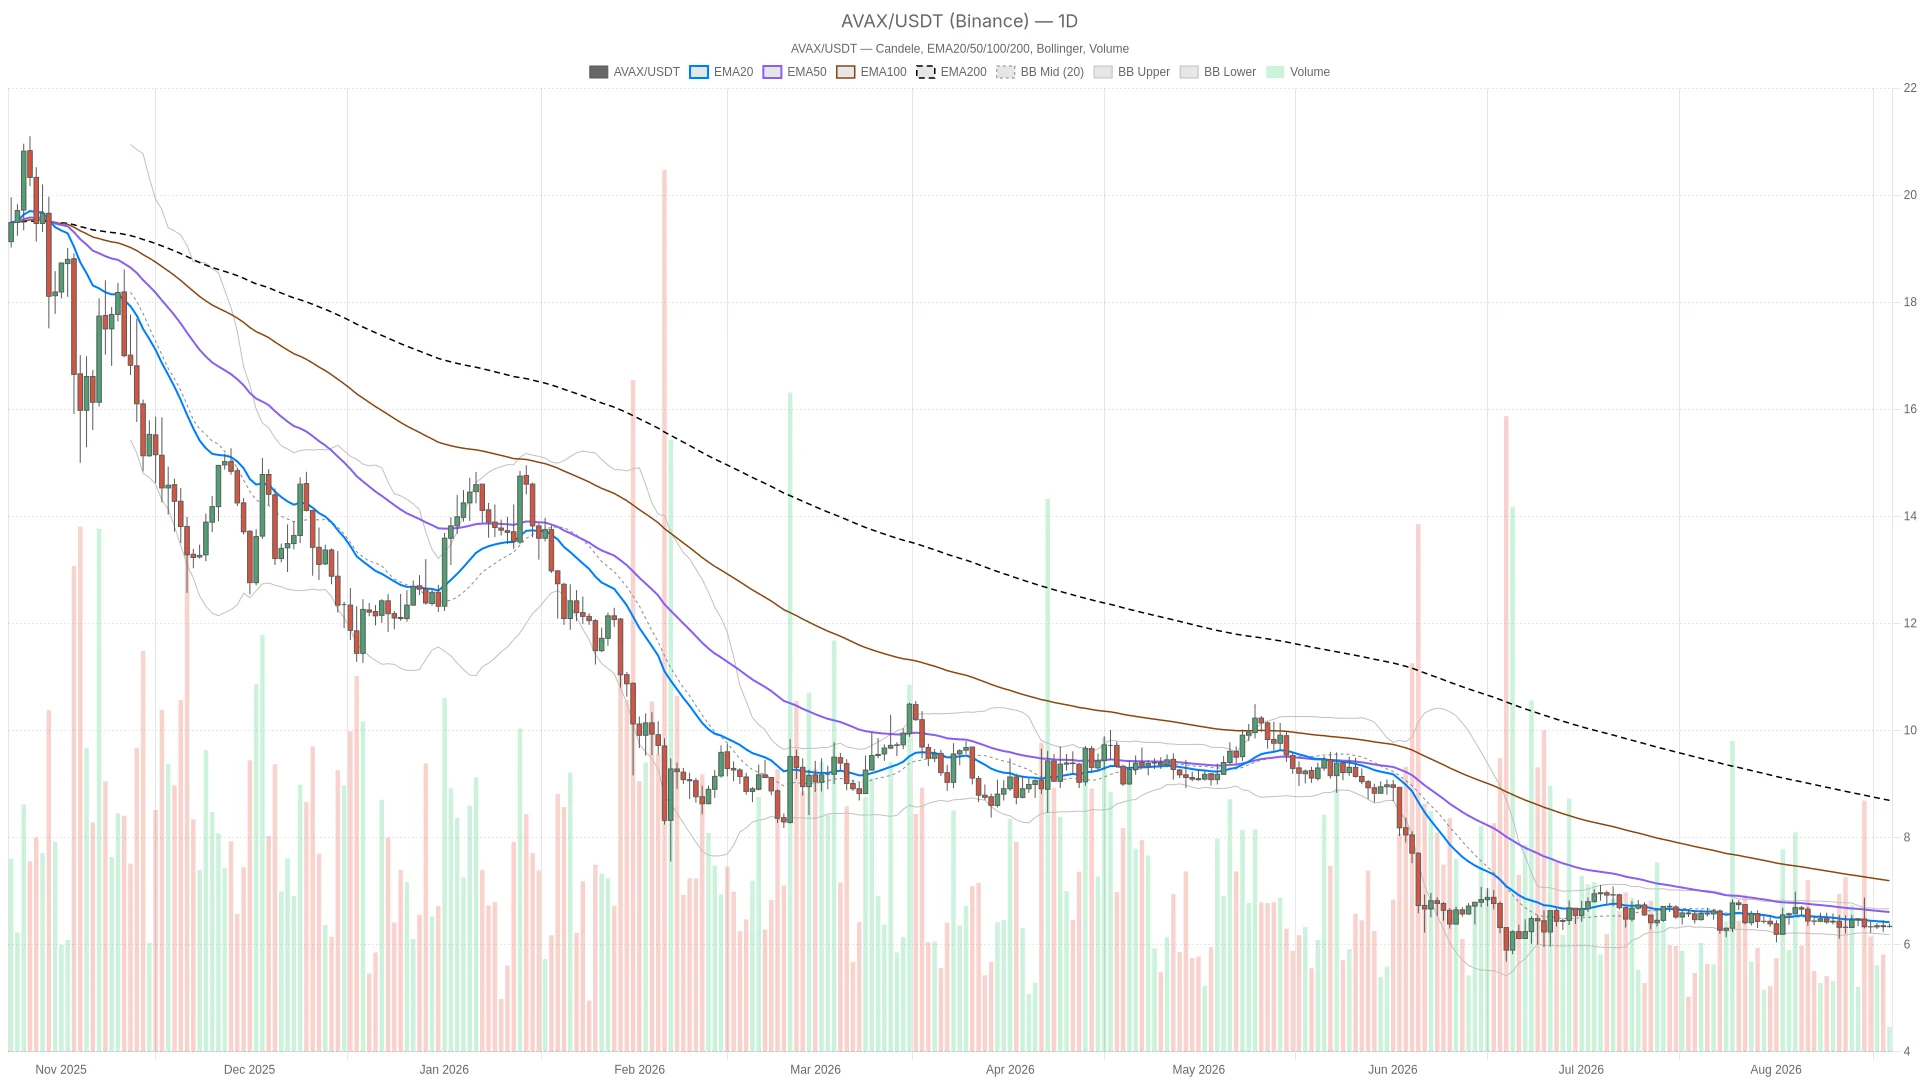 AVAX/USDT — daily chart with candlesticks, EMA20/EMA50 and volume.
 Summary
Key takeaways
- AVAX trades at $6.34 on August 19, 2026, near its $6.35 daily pivot.
- The daily trend remains bearish, with price below the EMA20 at $6.42 and the EMA200 at $8.69.
- Intraday compression has tightened sharply, with 1-hour ATR14 down to 0.03.
- DEX fees are mixed: Blackhole CLMM is down 15.25% in 24 hours, while Pharaoh CL spiked 2,380.45%.
- The Fear & Greed Index sits at 46, and Bitcoin dominance holds at 56.47%.
Daily Chart Still Belongs to the Bears
On the daily timeframe, AVAX trades at $6.34, below its EMA20 ($6.42) and EMA50 ($6.61). It also sits dramatically below its EMA200 at $8.69. That stacked EMA structure, with price under every major moving average, is the clearest signal in this dataset: the broader trend is still down. The market has not done the work yet to repair that damage. The daily regime reading itself confirms this as bearish.
Meanwhile, RSI14 on the daily sits at 44.94 — not oversold, not collapsing, just soft. That kind of reading appears when a downtrend has lost some acceleration but has not flipped into recovery mode. MACD backs that up: the line is at -0.06 against a signal of -0.05, with the histogram essentially flat at zero. That describes a market where bearish momentum has faded to near-neutral rather than reversing outright. Sellers are not pressing hard, but buyers have not taken control.
The Bollinger setup adds another layer: mid-band at $6.43, upper at $6.67, lower at $6.19. Price is trading below the midline, which keeps the bias tilted toward the lower half of the range rather than a bounce back toward resistance. Daily ATR14 is 0.25, meaning the asset is still capable of a meaningful single-day swing relative to its current price — roughly 4% of value in either direction.
As for the pivot structure, price is basically glued to the pivot itself at $6.35, with resistance at $6.38 (R1) and support at $6.31 (S1). That is a genuinely narrow battlefield for such an important level.
Intraday Tension Between the 1-Hour and 15-Minute Charts
The 1-hour chart is technically still labeled bearish, but its internals do not look like a market under selling pressure. EMA20, EMA50, and EMA200 are all bunched within a few cents of each other at $6.34, $6.35, and $6.39 respectively. That is a classic compression pattern, not a trending one.
Meanwhile, RSI14 on the hourly is 48.99, dead center neutral. MACD is flat at zero on both line and signal. Bollinger Bands have squeezed tight, with the mid at $6.34, upper at $6.38, and lower at $6.31. ATR14 has shrunk to just 0.03. This is a market that has stopped moving.
By contrast, the 15-minute chart flips to a neutral regime, with EMAs clustered right on top of price at $6.34–$6.35 and RSI14 at 43.23. MACD is flat here too. That suggests execution-level conditions are calm: there is no aggressive intraday selling forcing price lower, and no buying strong enough to challenge the daily downtrend.
The tension is straightforward: the daily chart says distribution and weakness, while intraday says wait and see. Traders leaning only on the hourly chart could mistake this quiet for stability, even though the bigger structure has not confirmed it.
On-Chain Activity and Broader Market Sentiment
Activity across Avalanche-based DEXs has been mixed, based on DeFiLlama-style fee data. Blackhole CLMM fees are down 15.25% over 24 hours and 57.2% over seven days. Joe V2.2 fees dropped 33.86% daily and 51.51% weekly. That is a meaningful pullback in trading activity across two of the network’s larger venues.
Pharaoh V3, by contrast, is up 62.85% over 30 days. Pharaoh CL has posted an outsized 2,380.45% one-day fee spike and a 632.67% weekly gain. Those numbers are large enough to suggest liquidity rotating within the Pharaoh ecosystem rather than a broad-based surge in network usage. Taken together, the picture reads less like organic growth and more like activity concentrating in specific pockets while overall volume cools.
Sentiment context adds a bit more color. The Fear & Greed Index sits at 46, classified as “Fear,” which aligns with a cautious rather than euphoric market. Total crypto market cap is around $2.287 trillion, up a modest 0.44% over 24 hours, while Bitcoin dominance holds at 56.47%. In other words, the broader market is not in panic mode. Capital is not rotating aggressively into altcoins like AVAX either. It is a backdrop of mild caution, not risk-on appetite.
Bullish Scenario
For AVAX to shift the narrative, price needs to reclaim the daily EMA20 at $6.42 and hold above the $6.35 pivot with conviction. Ideally, it should also push through the $6.38 R1 level and the upper Bollinger band. A daily close back above $6.42–$6.43 would start to repair the EMA stack and could open the door toward the $6.61 EMA50. The EMA200 at $8.69 remains a much bigger hurdle further out.
This scenario gets support if the current 1-hour and 15-minute compression resolves upward. A break of the tight $6.31–$6.38 range to the topside, paired with RSI pushing back above 50 across timeframes, would be the tell. What invalidates this: any daily close back below $6.31 (S1) would suggest the compression was just a pause before the next leg lower, not a base.
Bearish Scenario
By contrast, the more straightforward path, given the daily regime, is continuation lower. A break below $6.31 support, with daily RSI sliding under 40 and MACD histogram turning negative again, would confirm sellers are back in control. The likely target is the lower Bollinger band near $6.19. A broader move could extend toward the EMA200 gap still sitting far above at $8.69.
Still, that gap is a reminder of how much ground has been lost on the bigger trend. What invalidates this: a strong reclaim of the $6.42 EMA20 with follow-through volume would undercut the bearish case and force a reassessment of the daily structure.
Final Take: Positioning and Risk
Right now, the Avalanche price today reflects a market caught between a daily downtrend that has not been disproven and an intraday structure that is essentially asleep. That is not a comfortable setup for conviction trades in either direction. The daily ATR of 0.25 and the tight pivot clustering on lower timeframes mean a breakout, when it comes, could move quickly and catch positioning offside.
The DEX fee data hints at uneven on-chain engagement rather than a clear resurgence in network activity. A Fear & Greed reading of 46 suggests the broader market is not offering much of a tailwind either. Anyone watching this setup should treat the current range as exactly that — a range — until price commits to one side of the $6.31–$6.42 zone. Traders should size accordingly given the volatility the daily ATR implies is still on the table.
FAQ
What is the current AVAX price and pivot level?
On August 19, 2026, AVAX trades at $6.34, near its daily pivot of $6.35. Resistance sits at $6.38 (R1), while support sits at $6.31 (S1).
Is the daily AVAX trend bullish or bearish?
The daily trend remains bearish. Price is below the EMA20 at $6.42, the EMA50 at $6.61, and the EMA200 at $8.69, with daily RSI14 at 44.94.
What does on-chain activity show for Avalanche?
On-chain activity is mixed. Blackhole CLMM and Joe V2.2 fees have declined, while Pharaoh V3 is up 62.85% over 30 days and Pharaoh CL posted a 2,380.45% one-day fee spike.
{"@context":"","@type":"FAQPage","mainEntity":[{"@type":"Question","name":"What is the current AVAX price and pivot level?","acceptedAnswer":{"@type":"Answer","text":"On August 19, 2026, AVAX trades at $6.34, near its daily pivot of $6.35. Resistance sits at $6.38 (R1), while support sits at $6.31 (S1)."}},{"@type":"Question","name":"Is the daily AVAX trend bullish or bearish?","acceptedAnswer":{"@type":"Answer","text":"The daily trend remains bearish. Price is below the EMA20 at $6.42, the EMA50 at $6.61, and the EMA200 at $8.69, with daily RSI14 at 44.94."}},{"@type":"Question","name":"What does on-chain activity show for Avalanche?","acceptedAnswer":{"@type":"Answer","text":"On-chain activity is mixed. Blackhole CLMM and Joe V2.2 fees have declined, while Pharaoh V3 is up 62.85% over 30 days and Pharaoh CL posted a 2,380.45% one-day fee spike."}}]}
Article produced with the assistance of artificial intelligence and reviewed by the editorial team.






